
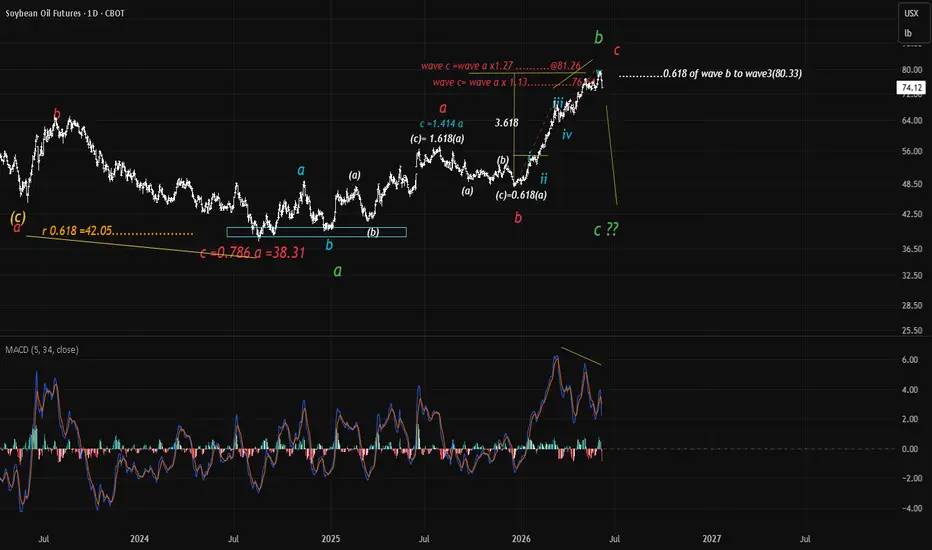
Since August 2024 market moved 111.6% over 448 trading days culminated in wave b of a larger degree to be followed by a move down for wave c.
Compelling indications of a high probable turn is seen with pronounced divergence between price and MACD followed by wave c(red) into a zone where 1.13 and 1.27 of wave a displayed loss of momentum and a 5-wave structure to complete wave c.
The wave relationship between wave v(0.618) to wave iii also fell in the resistive zone.
a 3.618 ratio from the top of wave i(blue) to wave v further adds weight to the topping possibility.
Weekly closing displayed a reversal minus which generally indicates a high chance of a reversal over and above the low closing.
A confirmation of the downturn is needed. Let the market unfold itself .
Compelling indications of a high probable turn is seen with pronounced divergence between price and MACD followed by wave c(red) into a zone where 1.13 and 1.27 of wave a displayed loss of momentum and a 5-wave structure to complete wave c.
The wave relationship between wave v(0.618) to wave iii also fell in the resistive zone.
a 3.618 ratio from the top of wave i(blue) to wave v further adds weight to the topping possibility.
Weekly closing displayed a reversal minus which generally indicates a high chance of a reversal over and above the low closing.
A confirmation of the downturn is needed. Let the market unfold itself .

免責事項
これらの情報および投稿は、TradingViewが提供または承認する金融、投資、取引、またはその他の種類の助言もしくは推奨であることを意図したものではなく、またこれらに該当するものでもありません。詳細は利用規約をご覧ください。
免責事項
これらの情報および投稿は、TradingViewが提供または承認する金融、投資、取引、またはその他の種類の助言もしくは推奨であることを意図したものではなく、またこれらに該当するものでもありません。詳細は利用規約をご覧ください。