
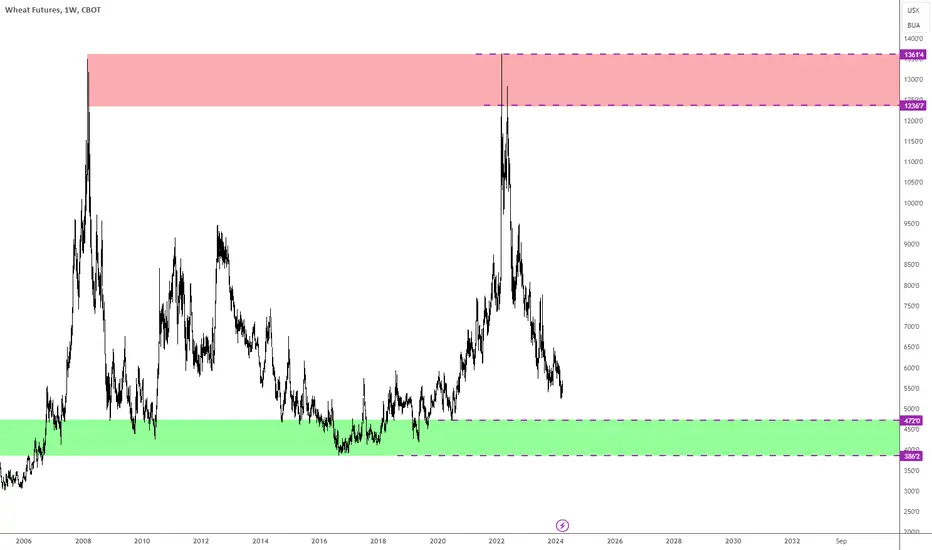
Supply and demand zones for Wheat on the weekly chart.
Once you enter the zone, look for the lower timeframe reversal patterns, extended waves, classic trendline breaks, etc.
Drop down to the Daily for refined supply and demand zones.
Drop down to 1 hour chart for the current trend after you see the reversal pattern.
Once you enter the zone, look for the lower timeframe reversal patterns, extended waves, classic trendline breaks, etc.
Drop down to the Daily for refined supply and demand zones.
Drop down to 1 hour chart for the current trend after you see the reversal pattern.

Chris Juliano
免責事項
これらの情報および投稿は、TradingViewが提供または承認する金融、投資、取引、またはその他の種類の助言もしくは推奨であることを意図したものではなく、またこれらに該当するものでもありません。詳細は利用規約をご覧ください。
Chris Juliano
免責事項
これらの情報および投稿は、TradingViewが提供または承認する金融、投資、取引、またはその他の種類の助言もしくは推奨であることを意図したものではなく、またこれらに該当するものでもありません。詳細は利用規約をご覧ください。