
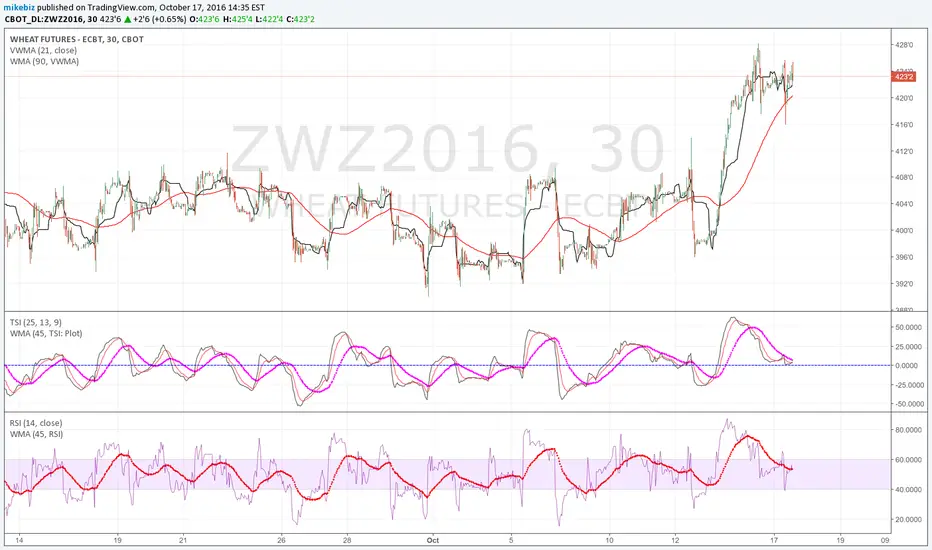
Looking at 30M chart, it's possible that wheat has made its pullback. The TSI could be finding support at 0 and RSI on 40. Based on next open and if these indicators move up off this support may try a dec wheat call.
Looking at the daily chart, the RSI and TSI look bullish and the ADX with +DMI looks like it could be setting up a change in dominance from down trend.

Daily looks like it hit some resistance at the 23.6% retrace area between the 6/8 high and 8/31 low. I think that price will move up to challenge other areas of retrace as noted on daily chart.
Looking at the daily chart, the RSI and TSI look bullish and the ADX with +DMI looks like it could be setting up a change in dominance from down trend.
Daily looks like it hit some resistance at the 23.6% retrace area between the 6/8 high and 8/31 low. I think that price will move up to challenge other areas of retrace as noted on daily chart.

関連の投稿
免責事項
これらの情報および投稿は、TradingViewが提供または承認する金融、投資、取引、またはその他の種類の助言もしくは推奨であることを意図したものではなく、またこれらに該当するものでもありません。詳細は利用規約をご覧ください。
免責事項
これらの情報および投稿は、TradingViewが提供または承認する金融、投資、取引、またはその他の種類の助言もしくは推奨であることを意図したものではなく、またこれらに該当するものでもありません。詳細は利用規約をご覧ください。