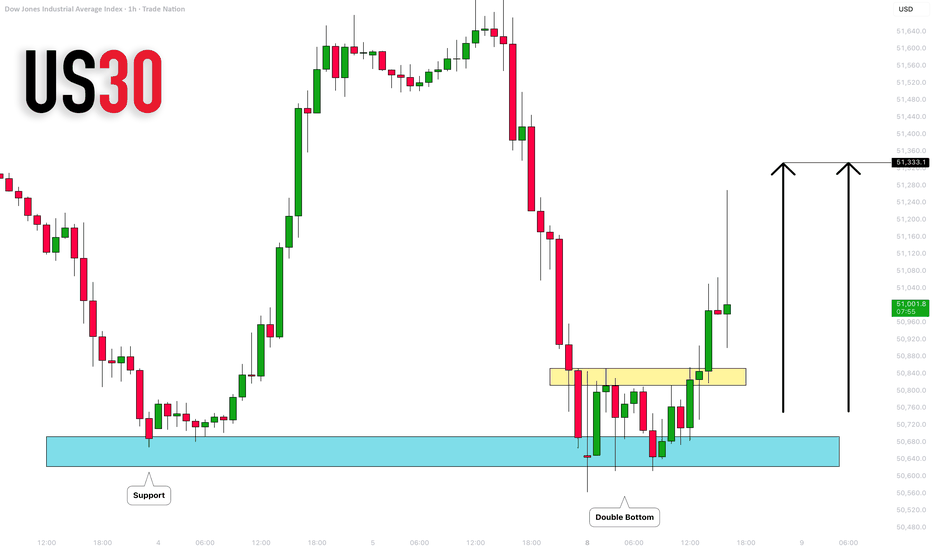
DOW JONES INDEX (US30): Bullish Move From Support
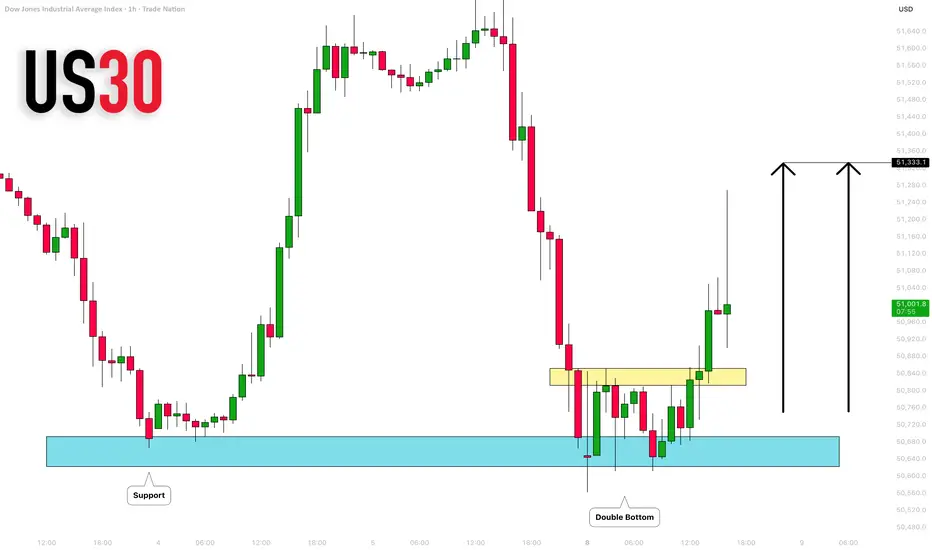
US30 is positioned to grow more after a formation
of a double bottom pattern on a key intraday/daily support.
I expect the index to reach 51330 level.
❤️Please, support my work with like, thank you!❤️
I am part of Trade Nation's Influencer program and receive a monthly fee for using their TradingView charts in my analysis.
Candlestick Analysis
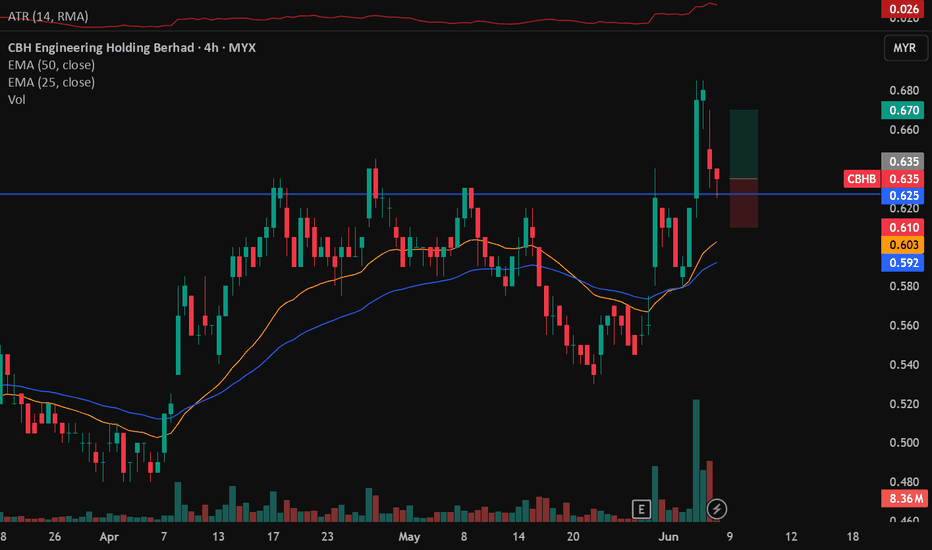
CBHB TRADE IDEA
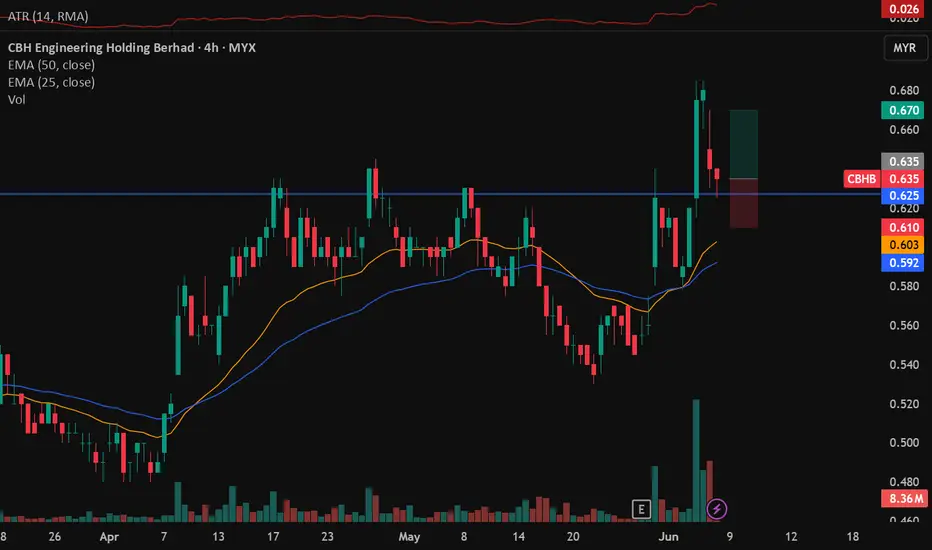
Price broke a strong multi week resistance level thats been retested multiple times on the 4hr chart. The breakout was fulled with high volume and on the pullback the candles and the volume does not signal that sellers have the strength to push price lower. A formation of a hammer candle marks our entry. Stops is 1ATR below the lows and tp is before the recent high.
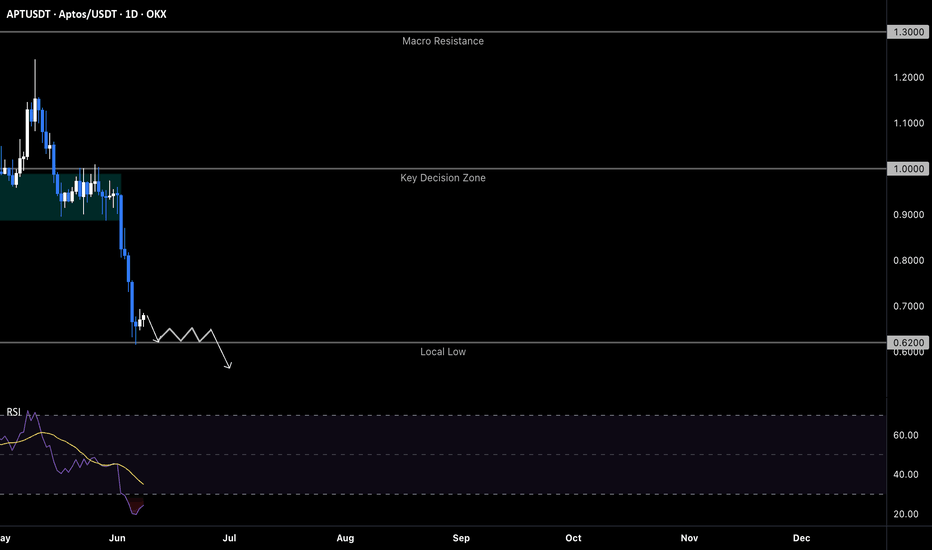
APTUSDT: liquidity sweep before the next leg downThe Macro Picture 🗺️
APTUSDT spent the better part of 2026 boxed inside a broad multi-month range, capped overhead by the $1.30 macro ceiling and pivoting around the $0.90–$1.00 core marked on the chart. The May rally stalled beneath that ceiling and printed a lower high, setting up the breakdown that followed. That structure has now gone through a structural reset — price sliced clean through the range floor and flushed without a meaningful retest, converting months of support into overhead supply. With the range gone, the path of least resistance bends lower, and APT now sits at ~$0.66, pressing directly into the $0.62 local low it just carved.
The Setup ⚙️
The Support Flip: The $0.90–$1.00 region that anchored price for months has flipped into overhead supply. Every bounce into the underside of the broken range is now being sold, and bulls have shown no appetite to reclaim it.
The Squeeze: Price is coiling in a tight Local Squeeze directly above the $0.62 floor, momentum compressed after the flush with RSI pinned near oversold and the signal line rolling over. A squeeze this deep into a downtrend tends to resolve with the trend — downward — rather than spring a reversal.
The Roadmap: Primary target sits at $0.62 — the local low the squeeze is pressing into; a decisive 1D close below it sweeps the sell-stops resting beneath the floor and opens continuation toward the next major support below the visible range. Invalidation: a sustained 1D close back above $0.90 would reclaim the broken range, invalidate this bearish thesis, and shift the read back to range-bound.
UNIUSDT: liquidity sweep before bearish continuationThe Macro Picture 🗺️
Three weeks ago, UNI sat at the lower edge of a $3.00–$4.00 horizontal range, and the read on this chart called for a bearish spike toward the $2.90 macro floor. Price didn't just deliver — it overshot. The $3.00 Range Floor lost cleanly in late May, the macro floor at $2.90 was swept clean through within a week, and the structure cratered into a capitulation low at $2.40 on June 6 with RSI tagging deep oversold near 22. The bounce that followed is mechanical rather than impulsive — a slow reflex from oversold, with the signal line still pointing down. The macro descent from $6.50 has entered its next phase: the post-capitulation reflex, where every prior support becomes the next ceiling to defend.
The Setup ⚙️
The Break: The $3.00 Range Floor that held through three months of accumulation lost without a meaningful defense. Every prior dip to $3.10–$3.20 had triggered absorption, but the late-May test produced no buyer footprint — the break confirmed bear control and opened the path to the macro flush.
The Sweep: The $2.40 print on June 6 cleared every stop sitting below $2.90 in a single capitulation move. Volatility monsters thrive on exactly this — a vertical wash that triggers sell stops and traps panic exits at the lows, freeing the structure for a controlled reflex back upward.
The Supply Flip: Price now drifts toward the $2.90–$3.00 confluence zone, where the broken floors desperately need to be retested as the new ceiling. Bears are positioned to defend this pocket — every reclaim attempt without volume confirmation becomes a high-confluence sell zone.
The Roadmap: Primary target sits below $2.40 — the structural read points toward a continuation leg once the reflex bounce exhausts itself at the supply flip, with the next macro pocket waiting below the capitulation low. Invalidation: a sustained daily close back above $3.00 would invalidate this bearish thesis and signal that the break was a stop hunt rather than a regime change.
ZEC: local squeeze with $480 destinationThe Macro Picture 🗺️
ZECUSDT has resolved the structural unwind exactly as the prior read mapped — the $280 capitulation wick held as the absolute low, bulls defended the $320–$400 reaction zone on the second test, and the $400 reclaim has now stabilized into a base in the mid-$400s. The chart has shifted from continuation to recovery, but the recovery is mechanical rather than aggressive. Price is compressing into a local squeeze just beneath $480 — the lost invalidation line from the prior read that now sits as the first major overhead supply test. The structure is asking how much resistance the reaction can absorb before momentum carries through.
The Setup ⚙️
The Squeeze: Price is compressing between the $400 reclaimed pivot and the $480 supply test, printing a tightening range with the $360 higher low underneath as structural support. RSI is rebuilding from the low 30s into the mid-40s — momentum is constructive but hasn't expanded yet, exactly the pattern that precedes a directional commit.
The Supply Test: $480 is the lost invalidation line from the prior read, now flipped into overhead supply. Bears are defending this band with structural sell orders, and a clean daily close back above $480 confirms the squeeze resolves to the upside.
The Higher Low: $360 is the bulls' active defense line — the post-capitulation higher low that confirmed the $280 wick was the absolute floor. Holding this level keeps the squeeze geometry intact and the recovery narrative on track.
The Roadmap: Primary target sits at $480 — a clean break and close above this band opens the path toward the $520 lost pocket top, then the $600 structural reset trigger. Invalidation: a sustained 1D close below $360 would invalidate the squeeze thesis, break the higher-low structure, and re-open the path back toward the $280 capitulation low.
EURCHF: Bearish Continuation After Trap 🇪🇺🇨🇭
EURCHF may continue retracing after a false violation
of a strong intraday horizontal resistance.
The price may reach 0.918 level.
❤️Please, support my work with like, thank you!❤️
I am part of Trade Nation's Influencer program and receive a monthly fee for using their TradingView charts in my analysis.
AUDUSD: Strong Bearish Pattern 🇦🇺🇺🇸
AUDUSD broke and closed below a horizontal neckline
of a huge head & shoulders pattern on a daily time frame.
It turns into a strong resistance.
The price will likely drop lower after a pullback.
Next goal will be 0.7
❤️Please, support my work with like, thank you!❤️
I am part of Trade Nation's Influencer program and receive a monthly fee for using their TradingView charts in my analysis.
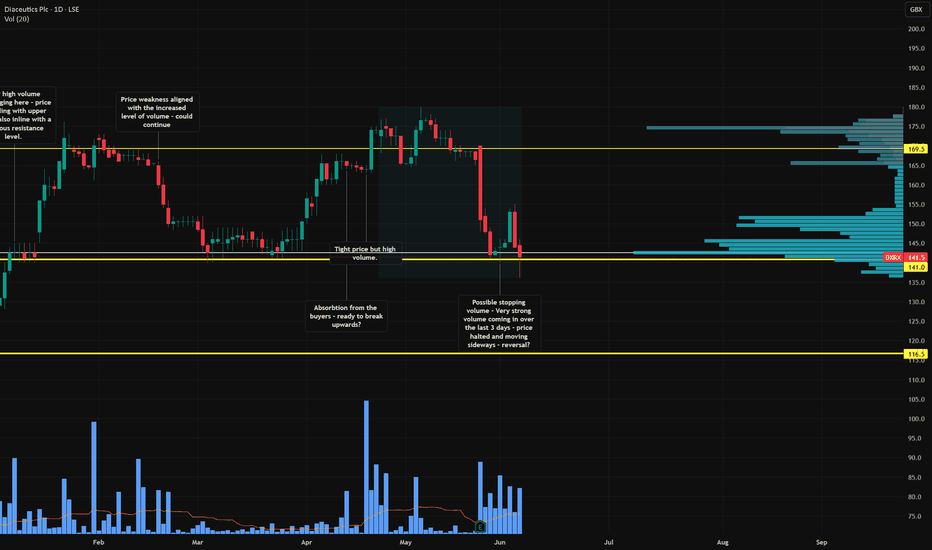
DXRX: heavy volume, no sell-off—buyers are absorbing the supply?A well formed trading range and the price is currently flirting with the 141p support level, which has had three notable interactions in the past. That kind of repeated testing of the same level is always worth paying attention to.
This came up on my screener on Monday evening as the price stubbornly closed near its open on solid volume. Since then volume has been elevated for nine consecutive sessions and yet the price refuses to sell off. That is a significant detail. When sustained above average volume fails to push a price lower, the most logical explanation is that buyers are absorbing every sell order being thrown at them.
The risk reward setup here also looks favourable. With a stop placed below the recent rejection wick around 134p, the ratio works out at approximately 1:2.9. Risking £1 for a potential return of £2.9 Everyone has a different risk profile of course, but for me that is a setup worth considering.
Price Target: 175p
Potential Reward: 22.5%
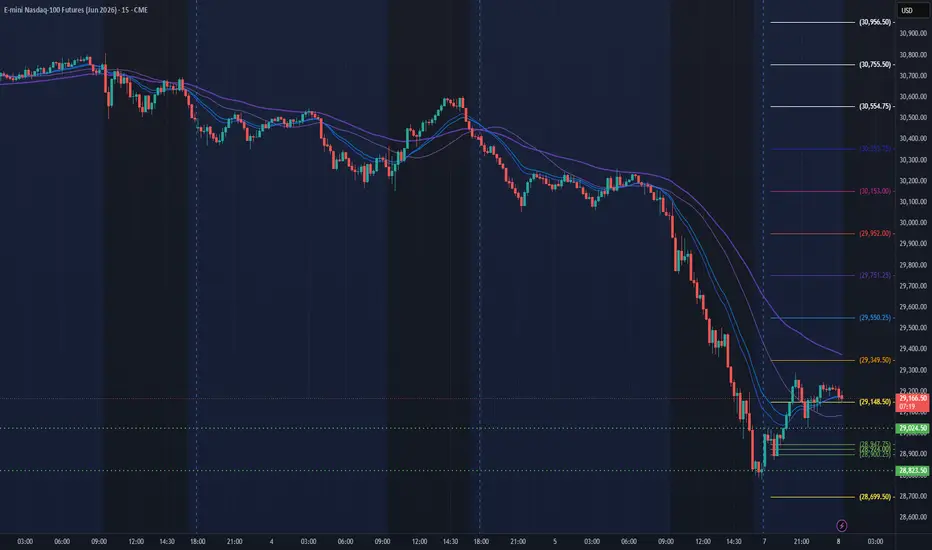
NQ Power Range Report with FIB Ext - 6/8/2026 SessionCME_MINI:NQM2026
- PR High: 29023.00
- PR Low: 28822.25
- NZ Spread: 449.25
No key scheduled economic events
Session Open Stats (As of 12:15 AM)
- Session Open ATR: 546.21
- Volume: 118K
- Open Int: 297K
- Trend Grade: Short
- From BA ATH: -5.1% (Rounded)
Key Levels (Rounded - Think of these as ranges)
- Long: 31505
- Mid: 25082
- Short: 22424
Keep in mind this is not speculation or a prediction. Only a report of the Power Range with Fib extensions for target hunting. Do your DD! You determine your risk tolerance. You are fully capable of making your own decisions.
BA: Back Adjusted
BuZ/BeZ: Bull Zone / Bear Zone
NZ: Neutral Zone
GBPUSD ANALYSISHey Traders;
After seeing the weekly sell off all because of the NFP news release last week, we could expect the pair to continue selling to the downside but the best thing to do now will be to wait for the retracement on the daily timeframe for a new LH before we can be looking to execute trade
EURJPY ANALYSISHey Traders;
The market had a large sell off during the NFP release last week and with that sell off we saw a break of multiple 4hr structure support(trend points) and currently the pair is at a LL area on the 4hr structure and we could be expecting a retrace for a LH after see seen that the 1hr broke structure resistance and pushing to the upside
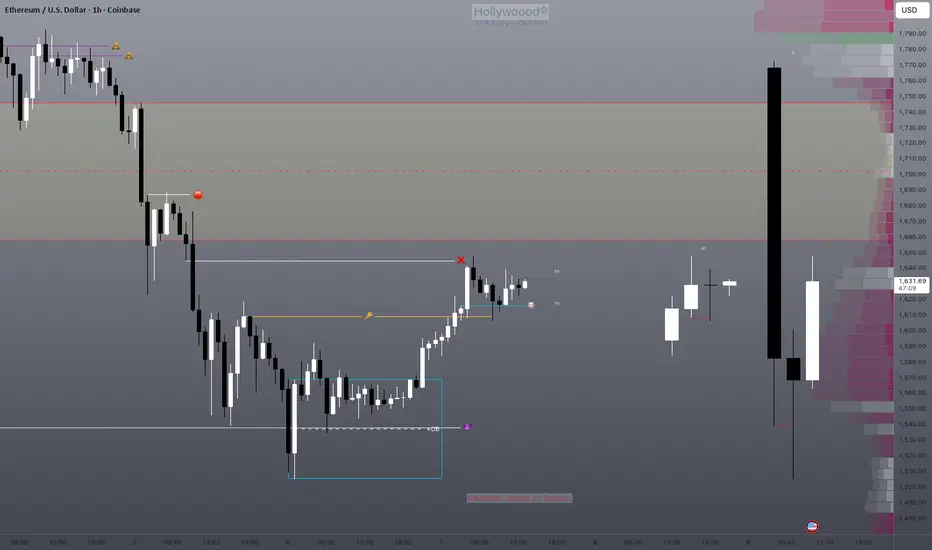
ETH: We have stricken the 1st meaningful support zonePrice will easily make it back to nearby untested break points when the opposing orders are present. We hit a massive support zone and were able to recover the nearest bearish imbalance.
Bullish OB holding us up well right now. If we get a bearish OB on 4H we should be on alert for bearish continuation if price has a hard time pushing up through it ⚠️
SOP TRADE IDEA
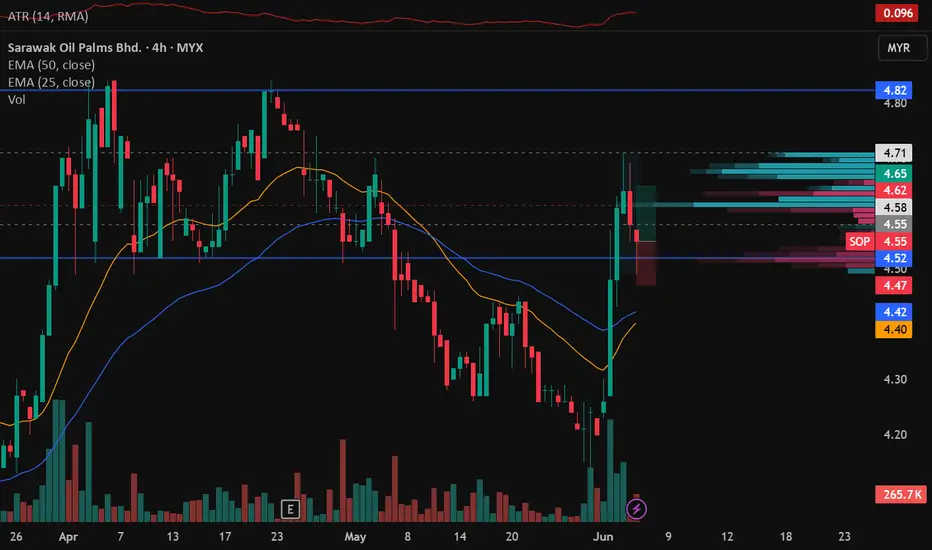
On the 4hr chart, price broke out of the downtrend with significant volume and pulled back into a weekly support zone at around 4.52. Looking at the Anchored Volume Profile's delta, there's quite big and heavy selling at the zone. However the zone not only holds, but printed a hammer candle. This indicates buyers are absorbing the sell orders and and are willing to defend that level. The hammer candle on the 1hr chart marks our entry. Stops is around 1 ATR below the lows and TP is before the high.
NATGATE TRADE IDEA
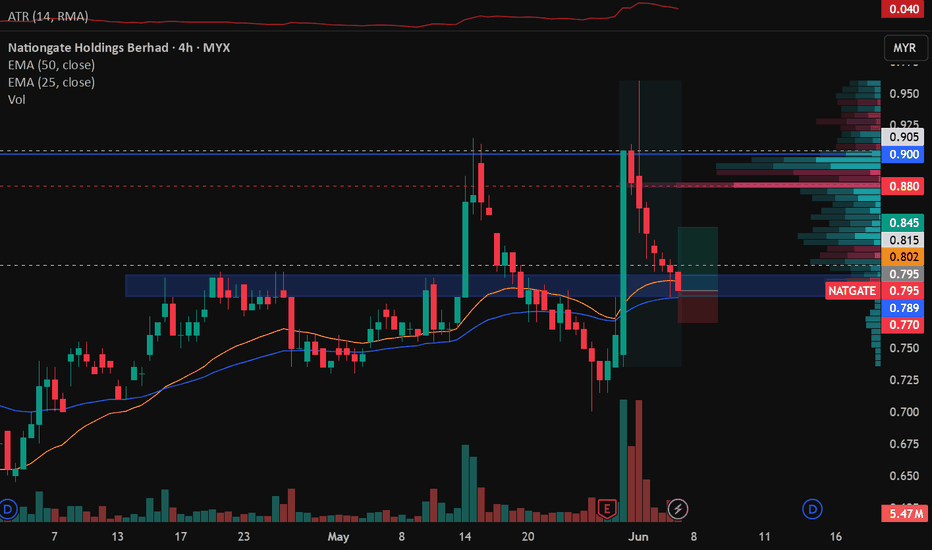
On the 4hr chart, price retraced to around 0.8 zone which acted as a weekly resistance in the past few weeks. It's also a zone where the Value Area Low is at meaning that buyers are probably going to defend that level and cause the price to increase since its considered cheaply priced. Price retraced to the zone from the Value Area High with decreasing volume indicating there's a decrease in sellers participating to push the market lower. The candles on the downside move also dont have big red bodies showing that sellers dont have that big of a strength. Dropping to the 1hr chart, a double bottom formed at the zone and the green candle at the second bottom indicates our entry. Stops is around 1 ATR below the lows and aim for a 2:1 RR.
NCC 6.4x volume spike a sign that supply has dried up?A clear series of rising lows building over the last couple of weeks, which is always an encouraging sign that supply is gradually drying up.
Then Friday delivered an extraordinary volume spike of 6.4 times the average. That is not a quiet day by any stretch. The volume profile on the right shows a significant concentration of activity weighted around the current price level, suggesting there is real participation and interest here rather than just noise.
The question now is whether this can build enough momentum to retest the highs around 160p.
Price target: 160p
Potential reward: 12.13%
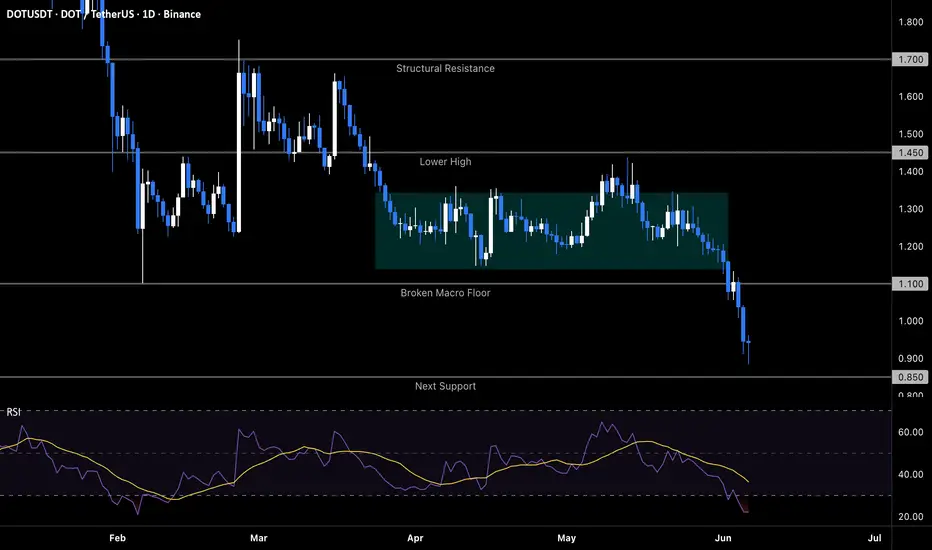
DOTUSDT below macro floor: capitulation pocket formingThe Macro Picture 🗺️
DOT broke the $1.10 macro floor cleanly last week — the multi-month range that held since the February capitulation has now failed, flipping the structural read from "compressing accumulation" to "post-breakdown trend." Price sits at $0.95 inside a fresh capitulation pocket with RSI pressed near 22, the deepest oversold print since February. The broken floor at $1.10 now sits as overhead supply, while the failed range above it ($1.20–$1.35) becomes a wall of trapped buyers who need price to reclaim before they can exit at breakeven. This is the kind of regime shift that demands a structural reset before any meaningful recovery can be priced in.
The Setup ⚙️
The Breakdown: The $1.10 macro floor that defended price for four months failed on the late-May test, with sellers driving a clean impulse leg into the $0.90s. The level didn't sweep and reverse — it gave way, confirming the broader trend rather than resetting it.
The Supply Flip: The $1.05–$1.15 band is now the first overhead test. Any RSI-driven reactive bounce has to fade or reclaim this zone, and that reaction will decide whether the breakdown extends or stalls into a new compressed range.
The Capitulation Pocket: The $0.85–$0.95 zone is where price is now searching for a structural low. RSI deep in the red below 25 sets up the mechanical conditions for a reactive bounce, but bounces inside trending breakdowns tend to get sold into supply rather than build reversals.
The Roadmap: Primary target sits at $0.85 — the next support
shelf where the impulse leg can find a floor and the capitulation pocket can complete. Invalidation: a sustained 1D close back above $1.15 would invalidate this continuation thesis and signal buyers reclaimed the broken floor, opening the path back into the failed range above.
ADAUSDT: bullish spike toward $0.2200The Macro Picture 🗺️
ADAUSDT has just completed one of the most violent structural resets in its 2026 history. The $0.2200 macro floor that held for four months was not swept — it was demolished, with bears driving price through it in a multi-day capitulation that cleared every long position built since February. RSI has plunged into the low-20s, the deepest oversold reading since the January peak — the kind of momentum exhaustion that historically marks a pause, not a continuation. Price now sits in a capitulation pocket near $0.1550, with the broken macro floor sitting overhead as the obvious magnet for any relief bounce.
The Setup ⚙️
The Reset: The June capitulation candle is the structural reset itself. Four months of trapped longs above $0.2400 have been liquidated in a single sweep, and momentum has reached the kind of stretched reading that demands a counter-move before bears can extend the trend further.
The Ceiling: The $0.2200 line has flipped from four months of macro floor into overhead resistance. This is now the high-confluence zone that desperately needs to be retested from below — late shorts will defend it, but the magnetic pull from the broken structure is what drives the bounce.
The Trigger: A reclaim of $0.1800 is the first confirmation that buyers are stepping back in. Until that level prints, price remains in capitulation drift; once it goes, the path opens toward the $0.2200 retest.
The Roadmap: Primary target sits at $0.2200 — the broken macro floor that now serves as structural ceiling, as indicated by the white projection. Invalidation: a sustained 1D close below $0.1500 would invalidate this bounce thesis and reopen the path toward the $0.1300 deeper structural support zone.s
BNBUSDT at macro floor: decision zone reachedThe Macro Picture 🗺️
The Broadening Formation that has defined BNB's entire 2026 structure has now arrived at its lower boundary. The June 1–2 spike above $700 cleared every breakout stop in a single session, parked price at $750, then unwound through the entire four-month range in five trading days. The previous setup invalidated cleanly at $640 as the structure promised, and the same $570 macro floor that absorbed February's capitulation is now being tested under very different conditions — arriving with downside momentum, not from a flush low. RSI on the daily has printed 25, the deepest oversold read since the February bottom.
The Setup ⚙️
The Rejection: The $750 spike was a textbook liquidity sweep — bears were defending the $700 ceiling for three months, and the failed breakout above it cleared trapped buyers in one impulse before reversing. This is the kind of structural rejection that retires a setup, not the kind that signals exhaustion at the top.
The Floor: The $570 zone is now the most consequential level on the chart. It held the entire 2026 structure intact from February onward, and bulls desperately need to defend it again to keep the Broadening Formation alive. A sweep low followed by a reclaim of $600 would frame this as the mirror image of the $750 trap — same mechanic, opposite side.
The Reaction: The character of the response here is what matters most. A long-wick rejection with a reclaim back above $600 turns the entire $570 visit into a liquidity grab and opens rotation toward the $640 mid-range. A sustained loss of $570 on a daily close transitions the structural read from "range under stress" to "Broadening Formation broken", with $500 as the next magnetic pocket.
The Roadmap: Primary target sits at $640 — a defended floor reaction followed by a reclaim of $600 would target the four-month range mid as the first realistic destination. Invalidation: a sustained daily close below $570 would invalidate this floor-defense thesis and open a structural flush toward the $500–$520 liquidity pocket where stops from the February low still cluster.
GBPUSD: Bearish Outlook Explained 🇬🇧🇺🇸
GBPUSD broke and closed below a strong rising trend line
on a daily time frame.
The price will likely continue falling after a pullback next week.
Next strong support is 1.3324
❤️Please, support my work with like, thank you!❤️
I am part of Trade Nation's Influencer program and receive a monthly fee for using their TradingView charts in my analysis.
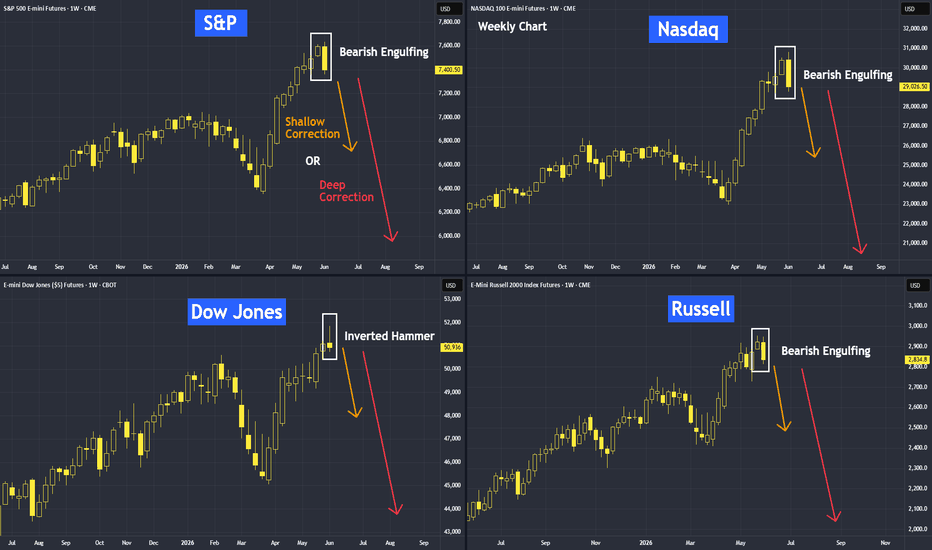
Upcoming Correction: Shallow or Deep?Friday’s closing completed the weekly chart, with all indices indicating a reversal pattern. A correction is imminent. The question is whether this correction will be shallow or much deeper. How can we tell? Stay tuned for my upcoming video in the coming days.
Disclaimer This analysis is based on technical studies and does not constitute financial advice. Please consult your licensed broker before investing.
Micro E-mini S&P 500 Index Futures & Options
Code: MES
Minimum fluctuation
0.25 index points = $1.25
Disclaimer:
• What presented here is not a recommendation, please consult your licensed broker.
• Our mission is to create lateral thinking skills for every investor and trader, knowing when to take a calculated risk with market uncertainty and a bolder risk when opportunity arises.
CME Real-time Market Data help identify trading set-ups in real-time and express my market views. If you have futures in your trading portfolio, you can check out on CME Group data plans available that suit your trading needs www.tradingview.com
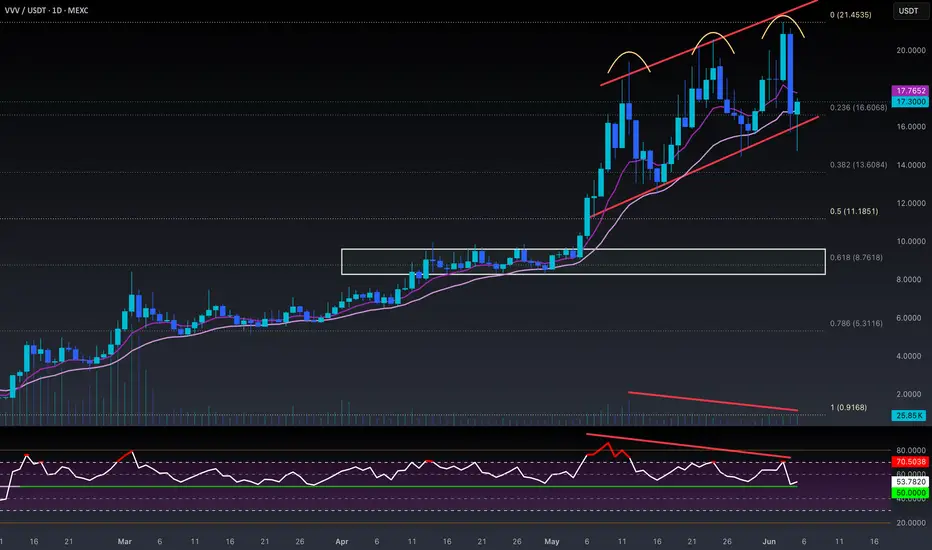
$VVV Top Confirmed with Bearish Engulfing + H&SNYSE:VVV TOP IS IN 💯
NASTY BEARISH ENGULFING Daily Close confirms Head & Shoulders reversal pattern (w/ a fake-out from upthrust).
PA responds with a dead-cat bounce into the bull flag (one last trap).
This will take a lot of time for the market to digest.
Should see a proper retest of the 50% gann level to decide next move.
Doubt that will hold with current macro market conditions coming online.
Would steer clear til ~$8-9 which is around the .618 Fib.
Better value buy sits ~$5 at the .786 fib
LOWER 📉