BITCOIN - Correction before the decline. Bearish trend BINANCE:BTCUSD.P remains in a bearish trend on both the local and global timeframes. Following the sharp sell-off and the formation of a new low, the market has entered a corrective phase, which may not last long
Bitcoin remains trapped in a deeply bearish structure after failing to establish acceptance above the 64,500 resistance zone and being rejected from that area on Tuesday. On both the daily and weekly timeframes, the market is returning to retest key technical levels. Technically, there is still no sign of strong institutional buying activity, and during this countertrend correction the market may form another short squeeze before continuing lower. From a medium-term perspective, Bitcoin may extend its decline toward major historical support levels at 53,500–49,000.
Resistance levels: 62350, 64250
Support levels: 60700, 59700
Bitcoin's global bearish structure remains intact. The market is testing the key 60K support zone, but the reaction remains relatively weak. As a result, the probability of a continuation lower is increasing. The next major downside target is 53K.
Technically, the market has left significant liquidity above the key daily level, as well as a liquidity pool above 64,250. A short squeeze into these areas could trigger a move lower toward the key zones of interest
Best regards, R. Linda  Short
Short
GOLD - A countertrend correction before a decline ICMARKETS:XAUUSD is in a corrective phase after printing a new low at 4268. Both the local and global bearish trends remain intact; however, the geopolitical backdrop continues to be unstable
Gold is undergoing a fundamental and technical shift to the downside, driven by several factors acting simultaneously: a sharp increase in expectations for further Fed rate hikes (now above 70% by December), a break and close below the 200-day moving average for the first time since October 2023, a stronger U.S. dollar above the psychological 100.0 level, and rising Treasury yields toward the 4.55–4.57% range
Technically, the market remains under pressure, and short positions continue to be the preferred strategy. A short squeeze into a liquidity zone could trigger another sharp decline toward support and lower target levels. However, a sudden positive shift in the fundamental backdrop could invalidate the local bearish structure
Resistance levels: 4353, 4368, 4400
Support levels: 4311–4300, 4268
The U.S. dollar is consolidating after a strong rally but shows no signs of weakness. This technical factor continues to weigh on an already bearish gold market.
From a technical perspective, gold may perform a retest of resistance as part of a liquidity-hunting move. A short squeeze into the 4380–4400 area could trigger a decline toward the key zones of interest at 4300–4250
Best regards, R. Linda  Short
Short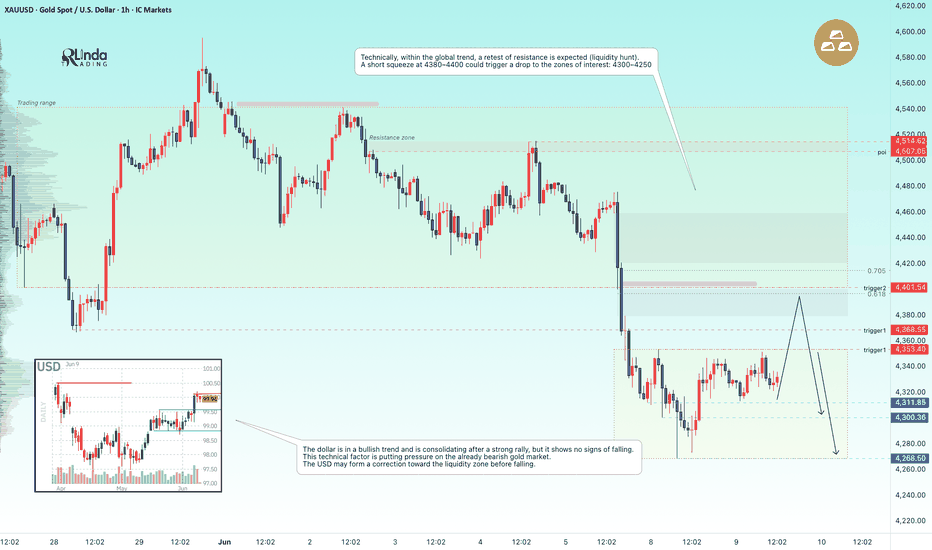
Gold Testing Key Fibo Layers -Wave (4) Top or Deeper Correction?Based on the Bearish Impulse Elliott Wave structure monitored on the H1 timeframe, the critical price levels to watch include:
Major Resistance: 4,415.447 – This marks the primary Confluence Zone, combining the H1 Supply block and the Fibonacci Retracement 0.786 layer. This is the ultimate invalidation threshold for the immediate bearish cycle.
Immediate Resistance Layers: 4,372.407 (Fibonacci 0.5) and 4,347.445 (Fibonacci 0.382) – Internal checkpoints where early sellers might re-enter the market.
Psychological Support: 4,268.253 – The previous swing low established by Wave (3), acting as the primary liquidity pool for the bears.
Major Liquidity Target: Anticipated extension zones below the 4,268 handle once Wave (5) gets fully triggered.
Market Debate
Is Gold building enough momentum to invalidate the bearish wave count before CPI?
The Bearish Case (Sellers): The structural damage inflicted by the rapid drop from Wave (2) to Wave (3) is immense. The current recovery is nothing but a temporary "Liquidity Hunt" to lure in early buyers. As long as the price stays capped below the major resistance at 4,415.447, the technical bias points toward a sharp rejection, initiating a Wave (5) impulsive decline to break below 4,268.
The Bullish Case (Buyers): The bulls have managed to mount a decent defensive stance at the 4,268.253 support layer. If the price can aggressively reclaim the internal Fibonacci levels at 4,347 and 4,372, it will signal short-covering momentum, potentially forcing a deeper structural correction back toward 4,450+ and putting the immediate bearish wave count on hold.
What's your take on this H1 structure? Will Gold face a clean rejection at the 4,415 major resistance, or will the bulls trap the sellers by extending the correction higher? Drop your thoughts and charts in the comment section below! Short 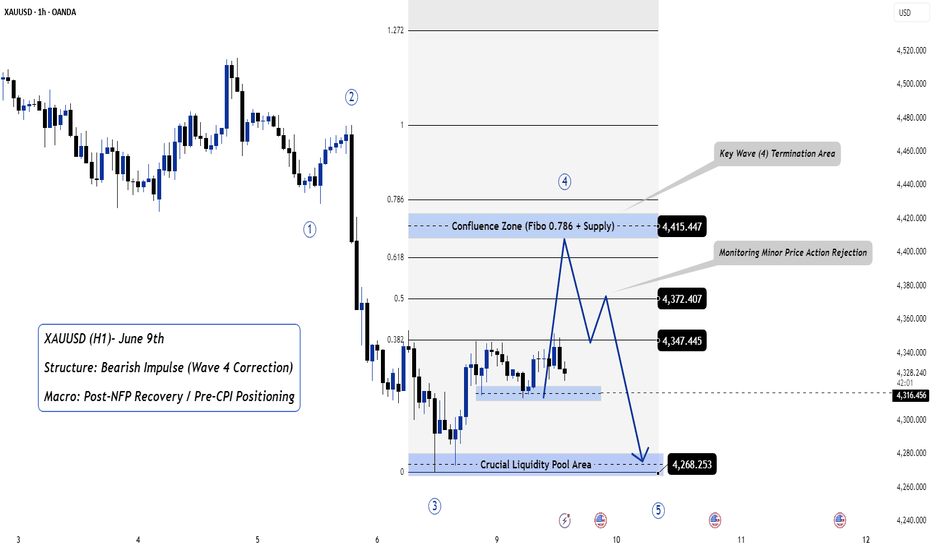

ETHUSDT - A countertrend correction before a decline Following a sharp decline, BINANCE:ETHUSDT is transitioning into a corrective phase, during which the market may enter a liquidity-hunting stage before another leg lower
The current rebound appears corrective in nature within a broader bearish trend. A breakout above 1,800 with strong momentum could improve the short-term outlook, but a recovery above $2,000 is required to shift the global trend. A loss of the 1,600–1,550 support zone would open the way toward 1,500 and then the key 1,400 area, where the monthly trendline is located.
The fundamental backdrop remains weak, and the market has shown only a muted reaction to the CLARITY Act headlines
Resistance levels: 1,712–1,721, 1,812
Support levels: 1,600, 1,550
A short squeeze could trigger a decline toward 1,600, while a close below 1,600 would open the potential for further downside toward 1,550–1,500. Long positions against the trend should be approached with caution
Best regards, R. Linda  Short
Short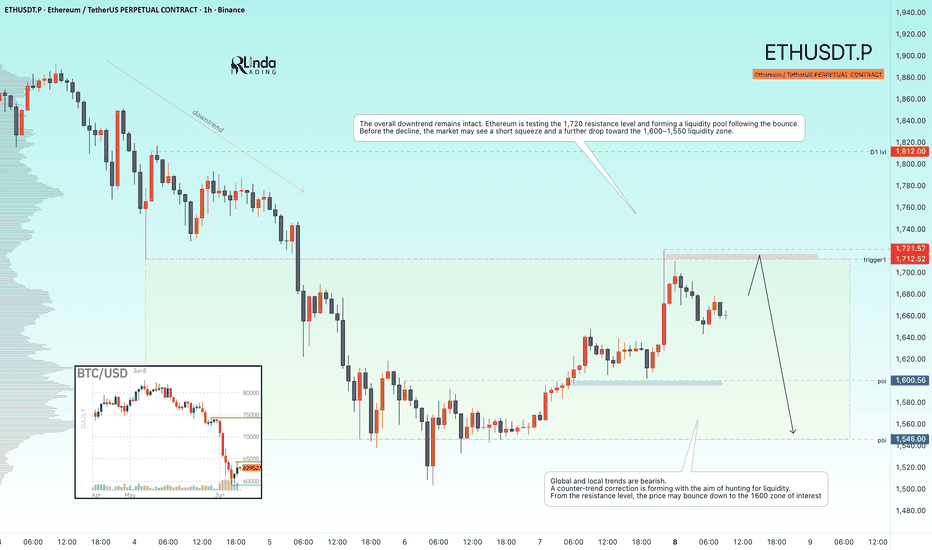
XAU/USD (Gold) | Technical & Fundamental Analysis 4H TimeframeMacro-Fundamental Overview
The Gold market (XAUUSD) is currently navigating an aggressive tug-of-war between geopolitical safe-haven demands and macroeconomic shifts. Heading into early June 2026, market participants are heavily focusing on the Federal Reserve’s upcoming policy trajectory. Recent economic indicators suggest persistent inflation data, causing institutional investors to trim risk and recalibrate expectations regarding rate cuts.
As Treasury yields experience a localized rebound, the opportunity cost of holding non-yielding bullion has risen. This has triggered a wave of institutional profit-taking and technical de-risking from the historic psychological highs, driving the spot price back down into key discount liquidity pools.
Technical Analysis & Smart Money Concepts (SMC)
The 4-hour (4H) timeframe exhibits a textbook bearish institutional delivery pattern, shifting from premium structural zones back toward major liquidity targets.
1. Market Structure & Liquidity Sweeps
Bearish Order Block & BSL: Price recently swept the Buying Side Liquidity (BSL) marked around the $4,572 - $4,598 zone. This expansion mitigated a well-defined bearish Order Block, trapping late retail breakout buyers before reverting.
Market Structure Shift (MSS): Following the liquidity grab, the market executed a clear Choch (Change of Character) and subsequent MSS to the downside, confirming institutional sell-side delivery.
2. Inefficiencies & Fib Retracement
Fair Value Gap (FVG): The aggressive downward expansion left a significant 4H FVG lower down (around the $4,425 - $4,460 region). Price is projected to aggressively draw toward this imbalance.
Premium vs. Discount Pricing: Utilizing the Fibonacci retracement tool mapped from the recent structural swing, the current mitigation at the 0.5 to 0.618 premium level offers an optimal trade entry (OTE) for a sustained short position.
3. Targets & Outlook
Sell-Side Liquidity (SSL): The primary target for this bearish expansion is the Weak Low resting at $4,363, where a massive cluster of sell-side liquidity is exposed.
Trading Setup Specifications
Strategy: Short (Sell Limit / Market Execution at Premium)
Entry Zone: $4,572.000 - $4,598.000 (Order Block / 0.618 Fib Premium)
Invalidation (Stop Loss): $4,605.000 (Above the Liquidity Sweep High)
Take Profit 1 (Partial): $4,450.000 (FVG Fill)
Take Profit 2 (Main Target): $4,364.000 (Equal Lows / SSL) Short 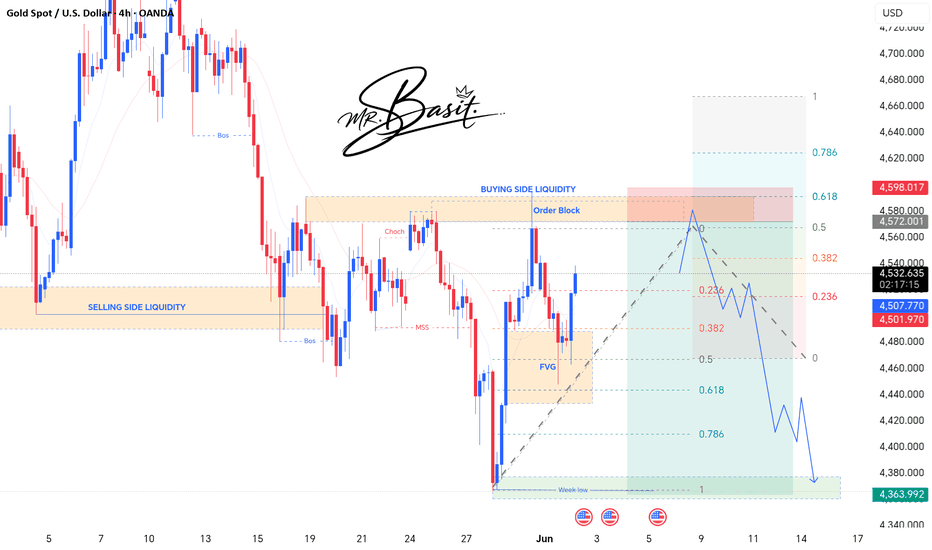
Short 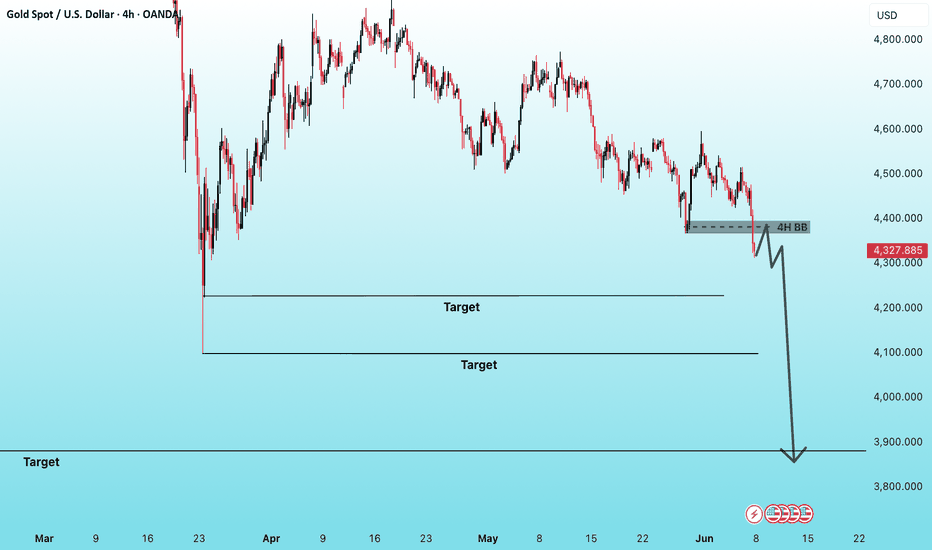
 Short
Short
Short 
GOLD - Bear market. A correction before the decline ICMARKETS:XAUUSD has broken below consolidation support, exiting the range and transitioning into a continuation of the downtrend. The key drivers are Friday's NFP report and a strong U.S. dollar
Gold is experiencing a bearish shift in both its fundamental and technical backdrop. The labor market report has altered expectations for future Fed policy, while the break below the 200-day SMA is adding significant pressure to the metal. The only notable positive factor remains the COT data: smart money positioning continues to be bullish and is at an 18-week high, even as price continues to decline.
A short-term corrective rebound toward the 4,368–4,400 area remains possible before the downtrend resumes. A close below 4,300 would open the path toward 4,260, followed by the 4,160–4,030 zone. For a trend reversal to occur, price would need to recover above 4,510–4,590, which can theoretically be viewed as the key reversal threshold
Resistance levels: 4,368, 4,400
Support level: 4,300
At the end of the trading session, the market began a correction that may extend toward the highlighted areas of interest at 4,368–4,400. A short squeeze could trigger a continuation of the decline toward the key daily level and liquidity zone at 4,300
Best regards, R. Linda Short 
 Short
Short
 Long
Long
 Long
Long
BITCOIN - A pullback before a drop to 60K, or perhaps even lowerBINANCE:BTCUSDT is moving toward 59,800 — the key support zone. However, after retesting a local level, the market is forming a correction against the broader trend
The market remains in panic mode and is testing the 60K area. Dynamic buyers have yet to appear, while fear continues to intensify. A move below 60K could trigger a cascade of liquidations, as many institutional hedging strategies are concentrated around this level.
There is currently no fundamental support for the market, while a series of weak news catalysts has fueled aggressive selling. Large funds continue transferring Bitcoin to exchanges.
Technically, the primary area of interest remains 59,800–53,300. Before reaching this target zone, Bitcoin may enter a local corrective phase
Resistance levels: 64,000, 64,740, 65,360
Support levels: 61,350, 59,800
A long squeeze from local support is driving the current correction. Technically, this is not buying pressure but rather a reaction to profit-taking. The market has entered a liquidity-hunting phase ahead of a potential continuation lower. Key triggers (areas of interest) are located at 63,955 and 65,360. A short squeeze could trigger the next leg down.
Best regards, R. Linda Short 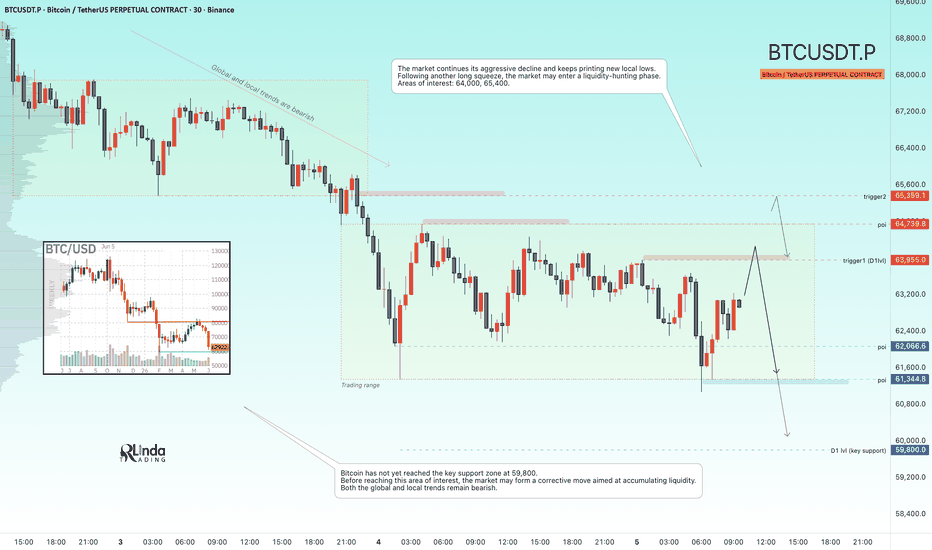
XAUUSD 4H Analysis – ABC Correction Near Key Support ZoneXAUUSD remains within a broader bearish structure after completing a five-wave decline and forming an ABC corrective pattern. Following the completion of Wave A near the recent highs, price has continued to respect bearish order flow, with multiple rejections from the Order Block (OB) and Fair Value Gap (FVG) resistance zones.
The latest decline confirms that sellers remain active at premium levels, preventing any sustained bullish continuation. Each rally into resistance has been met with selling pressure, resulting in a series of lower highs and maintaining the overall bearish structure.
Price is now approaching a significant support area between 4,422 and 4,409, where a higher-timeframe FVG remains unfilled. This zone represents the primary target for the current decline and could attract liquidity before the next major move develops.
Bearish Scenario:
If selling momentum continues, XAUUSD is likely to complete Wave (B) within the 4,422–4,409 zone. A sweep into this area would fill the imbalance and complete the corrective decline from Wave A. As long as price remains below the recent OB and FVG resistance, the downside target remains valid.
Bullish Scenario:
Should buyers react strongly from the 4,422–4,409 support zone, XAUUSD could begin developing Wave (C) to the upside. A bullish reaction would likely target the nearest FVG resistance first, followed by a potential recovery toward the previous swing highs. This scenario would be strengthened by a bullish displacement and a break of the recent lower-high structure.
For now, the market remains bearish in the short term, but price is approaching a key area where a larger bullish correction may emerge. The 4,422–4,409 zone remains the most important region to watch for the next directional move. Short 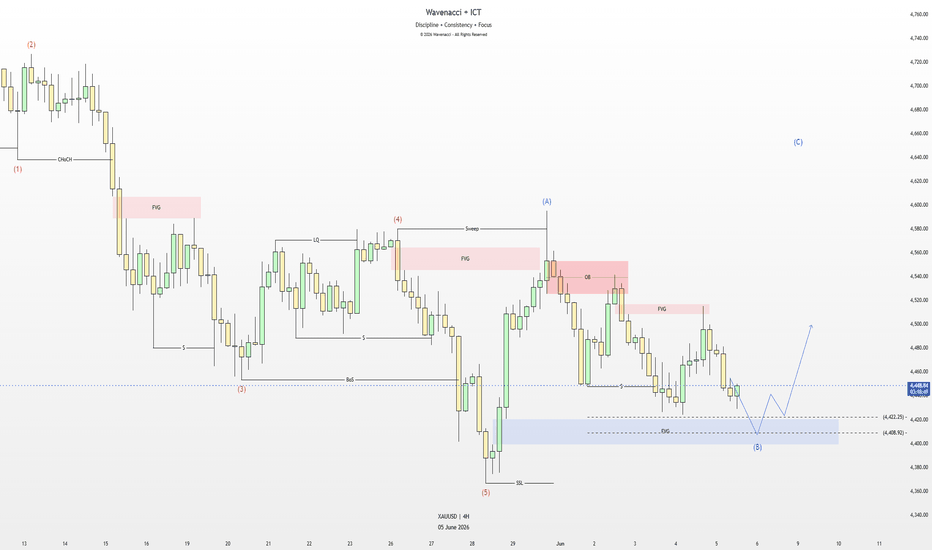
GOLD - The bearish trend may continue...ICMARKETS:XAUUSD has entered a corrective phase after printing a new local low. Against the backdrop of a strong U.S. dollar, the bearish trend in gold may continue...
Gold has received temporary relief from ceasefire-related headlines, but pressure from the dollar and hawkish Fed expectations remains intact. The key event ahead is Friday’s Non-Farm Payrolls (NFP) report. Geopolitical developments continue to play a decisive role.
Technically, within both the global and local downtrend, gold is consolidating inside the 4425–4550 range. Due to the uncertainty factor, the market has entered a corrective phase and a liquidity-hunting stage, during which it may test either 4496 or 4540 before resuming its decline.
Resistance levels: 4496, 4540, 4589
Support levels: 4456, 4425, 4400
The U.S. dollar remains in stagnation (consolidation) within a bullish trend. The geopolitical backdrop continues to support the dollar and weigh on gold, which is currently in a corrective phase. A short squeeze at 4496 could trigger a decline toward 4425–4400. Additionally, if the market fails to react at 4496, gold may test 4540 before moving lower.
Best regards, R. Linda Short 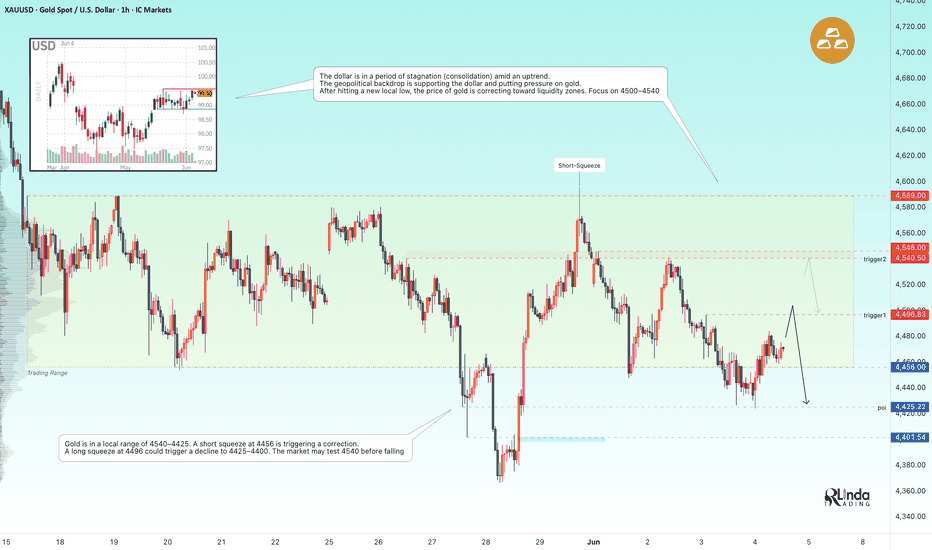
BTCUSD Weekly Analysis – Bearish Structure Targets Lower LevelsBTCUSD remains under bearish pressure on the weekly timeframe after completing a major liquidity sweep near the highs and subsequently breaking market structure to the downside. Since then, price has continued to form a series of lower highs and lower lows, confirming that sellers remain in control of the broader trend.
The recent recovery failed to establish a meaningful bullish continuation and was met with selling pressure near the Fair Value Gap (FVG) resistance zone. This rejection suggests that market participants are still using rallies as opportunities to distribute positions rather than accumulate for a sustained move higher.
From a structural perspective, BTCUSD appears to be seeking deeper inefficiencies below current price levels. The next major downside targets are located around 53,700 and 50,400, where unfilled higher-timeframe imbalances remain. These levels represent significant draw-on-liquidity areas and could attract price if bearish momentum continues to dominate.
Bearish Scenario:
As long as price remains below the recent FVG resistance and continues to respect the lower-high structure, BTCUSD is likely to continue its decline toward 53,700. A decisive move below this level could extend the correction toward 50,400, completing a deeper retracement and filling the remaining weekly imbalance.
Bullish Scenario:
If buyers manage to defend the current support area and generate a strong bullish displacement that breaks the most recent lower high, the market could enter a larger corrective rally. In this case, BTCUSD may revisit the nearby FVG resistance zones before deciding its next directional move. However, this scenario requires a clear shift in market structure and sustained buying momentum.
For now, the weekly chart continues to favor the bearish outlook, with 53,700 and 50,400 remaining the primary downside objectives before a larger bullish reaction becomes more likely. Short 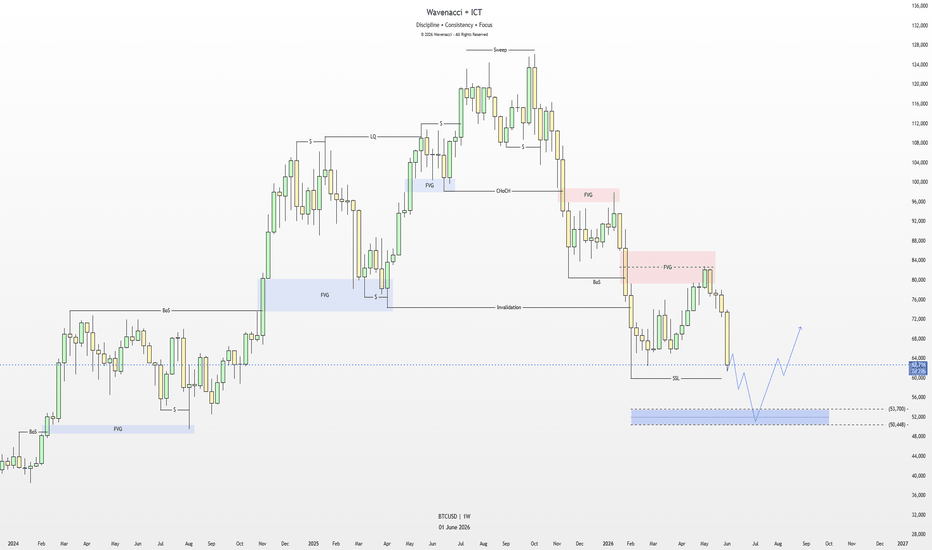
Long 
 Long
Long