XVG Fractal 2027Edit - Verge breakout is expected soon. In my opinion the bottom is in, the fractal projection suggests ATH around $2 This is not a financial advice. Do you own research.Longby marqtz117
XAU/USD 04 September 2026 Intraday AnalysisH4 Analysis: -> Swing: Bullish. -> Internal: Bearish. Bias and analysis to remain the same as analysis dated 30 June 2026. Price did not print bullish CHoCH to indicate bullish pullback phase initiation. Price instead printed a new low followed by a bullish CHoCH Price is currently trading within and established internal range, however, I will continue to monitor price with respect to depth of pullback. Intraday expectation: Price to trade up to either premium of internal 50% EQ, orby Khan_YIK222
Silver | Has Wave IV Ended, or Is One More Decline Still Ahead?⏱️ Reading Time: About 2 Minutes 🟦 Scenario 1 | Bullish Case In the bullish scenario, Wave IV may have already been completed as a Zigzag, while Wave II of the same degree formed an Expanded Flat. This difference is consistent with the Elliott Wave guideline of alternation between corrective waves. However, confirmation of a continuing bull market does not depend solely on higher prices. After each advance, the current structure should produce a clear and clean correction appropriate to its waby Mehdi_Abbasi_EWP11
Gold | The Waves Remember What Price ForgetsGold | When the Larger Waves Speak ⏱️ Reading Time: About 3 Minutes From the major market low in 1999, Gold has developed a long-term bullish structure. The market is now at a point where the larger-degree wave structure becomes increasingly important. At this stage, two primary structural interpretations remain under consideration. 🟦 Scenario 1: Bullish Case The bullish scenario remains a structural possibility, but it has not yet received final confirmation until the previous all-time highby Mehdi_Abbasi_EWP227
XAU/USD 03 September 20206 Intraday AnalysisH4 Analysis: -> Swing: Bullish. -> Internal: Bearish. Bias and analysis to remain the same as analysis dated 30 June 2026. Price did not print bullish CHoCH to indicate bullish pullback phase initiation. Price instead printed a new low followed by a bullish CHoCH Price is currently trading within and established internal range, however, I will continue to monitor price with respect to depth of pullback. Intraday expectation: Price to trade up to either premium of internal 50% EQ, orby Khan_YIK2
GBPUSD GBPUSD – Current Bias: Bearish This week has been dynamic. I initially anticipated a continuation of bullish momentum from Tuesday, but the structure has shifted and the higher-probability narrative now leans clearly bearish. On the 30-minute timeframe, clean liquidity sits just above current price. I expect a potential bullish push during the London session open (10:30 AM SA time) to sweep that liquidity. If price sweeps the high and shows clear rejection, the path of least resistance pointsby CoolSlavesFx1
ETH Has Institutional Demand ...But Macro Is Driving the MarketThere are two forces worth paying attention to in ETH right now: Macro pressure is increasing, while institutional ETH demand remains positive. For intraday traders, the question is which force is actually controlling price. Right now, I believe the answer is macro . MACRO RISK IS CONTROLLING CRYPTO Renewed U.S.–Iran fighting has pushed Brent crude toward $95 , the U.S. 10-year yield toward 4.82 %, and strengthened the dollar. At the same time, markets are now pricing roughly a two-Longby Crypto_Saint_0
DXY | The Structure That May Define the Next Decade DXY | The Structure That May Define the Next Decade 🌀 ⏱️ Estimated Reading Time: 3 Minutes On the current DXY chart, two major long-term scenarios remain under consideration: a Bullish Scenario and a Bearish Scenario. The difference between them begins with one critical question: What exactly is the structure of the major move from the 2008 low to the previous peak? The answer may help define the long-term direction of the U.S. Dollar Index. 🟢 Scenario One | Bullish Structure and Long-Term Cby Mehdi_Abbasi_EWP10
Bitcoin 1H | The Wave at the CrossroadsHey everyone, Here’s my latest Bitcoin 1H update, focusing on the current structure and the impulsive pattern that has been developing from the recent low. Based on the Elliott Wave Principle, I’m currently treating this move as a potential five-wave impulsive structure. The main question now is the relationship between Wave 4 and Wave 5, because the way this section develops could give us an important clue about the next higher-degree structure. In Case 1 — the Bullish Case, Wave 4 may alreaLongby Mehdi_Abbasi_EWP11
Silver | Let the Waves SpeakSilver | 1-Hour Structure Update ⏱️ Reading Time: About 3 Minutes At this stage, Silver presents two main structural paths. Recent price action has provided new information about the position of the waves, but the continuation of the structure—and especially the behavior of the current correction—will determine which scenario gains more confirmation. 🟦 Scenario 1: Bullish Case In the bullish view, the market is expected to remain in an upward phase for at least three waves. At the moment, thLongby Mehdi_Abbasi_EWP8
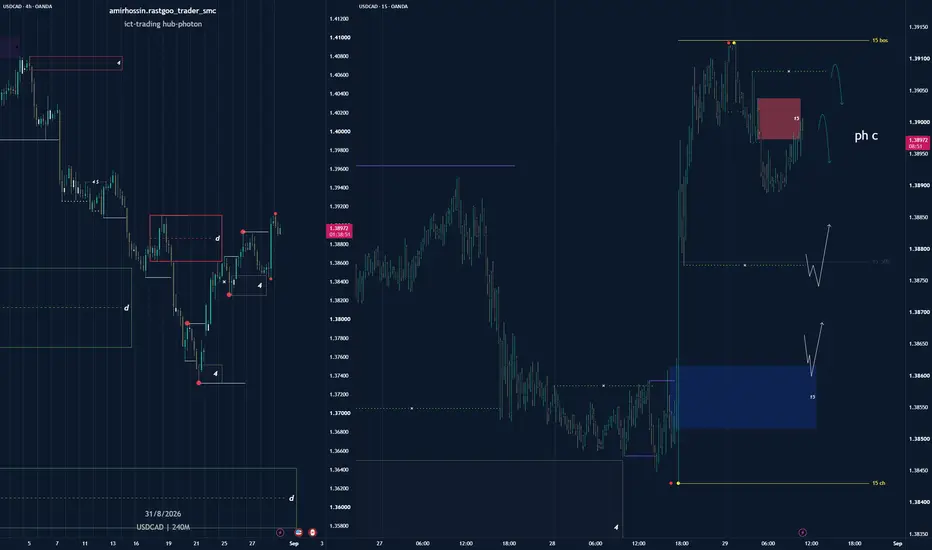
15 bearishIt's a 15-minute sell, maybe it will run out of liquidity after hitting, but be careful, it's not a good place to enter a sell with a strong signal because it might still go higher to attract liquidity.by amirhossin_trader_smcUpdated 1
15 bearish15 is bearish and I am looking to sell from supply and buy short from support. I will only buy long if the 15-minute ceiling is broken strongly because the bearish strength is greater at all times.by amirhossin_trader_smcUpdated 0
15 bulishAccording to previous analysis, all timeframes are bullish and I am only looking to buy unless proven otherwise.by amirhossin_trader_smcUpdated 0
Crude Oil | Three Nested Structures or a Larger Correction?⏱️ Reading Time: About 2 Minutes On the 1-hour crude oil chart, the current structure has reached an important point where two main paths remain possible. However, for now, my primary focus remains on the bullish structure. From the recent low, the market is showing signs of impulsive behavior and may be developing several nested 1 and 2 structures across different degrees. It is still too early to say with certainty that all of these Waves 1 and 2 have been completed, as part of the current mLongby Mehdi_Abbasi_EWP10
15 bearishI'm still a 15-minute sell unless the strong 15-minute ceiling is broken, then I'll look for a buy signal on the upside.by amirhossin_trader_smcUpdated 0
The short-term 4-hour chart is bullish, but the long-term 4-hourThe short-term 4-hour chart is bullish, but the long-term 4-hour chart is still bearish. The short-term 4-hour is bullish but the long-term 4-hour is still bearish. I still expect to see a sell signal on the 4-hour to reach the daily support area below unless our major 4-hour high is broken, in which case I'm just looking to buy.by amirhossin_trader_smcUpdated 0
15 minutes is bearish but I currently have a short buy to the su15 minutes is bearish but I am currently short buying to the supply zone I am looking for a sell signal from the supply zone. Note that it is bearish on all time frames except the 4-hour chart We are bullish on the 4-hour chart and it may continue to rise.by amirhossin_trader_smc0
XAU/USD 02 September 2026 Intraday AnalysisH4 Chart: -> Swing: Bullish. -> Internal: Bearish. Bias and analysis to remain the same as analysis dated 30 June 2026. Price did not print bullish CHoCH to indicate bullish pullback phase initiation. Price instead printed a new low followed by a bullish CHoCH Price is currently trading within and established internal range, however, I will continue to monitor price with respect to depth of pullback. Intraday expectation: Price to trade up to either premium of internal 50% EQ, or Hby Khan_YIK1
15 minWe are in a 15-minute bullish correction. We are in a 15 minute bullish correction Short sell long buy only in 15by amirhossin_trader_smcUpdated 0
15 ber4h ber The Major Daily trend is bullish for me, but it is still bearish at 4 hours and 15 minutes.by amirhossin_trader_smcUpdated 0
15 min15 has not gained liquidity, it may sweep its ceiling We are in a strong support area for 4 hours, but in 15 minutes we are still in a downward trend, we are in a correction phase or phase C. Until the strong ceiling of 15 is broken, I still see it as bearish.by amirhossin_trader_smcUpdated 0
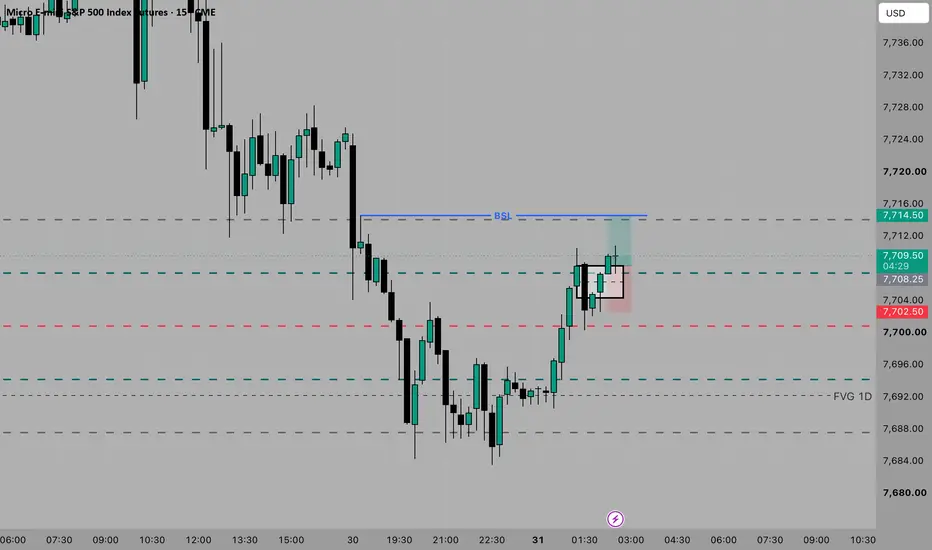
SP LONDON SCALPHunting some handles here. My Draw On Liquidity is that FVG now that the SSL has been taken. Longby ATH_FraktalUpdated 0
Silver | XAG/USD | Elliott Wave Structure Analysis on 4H TimefraWhen analyzing the current Silver structure, two main scenarios remain possible. The purpose of this analysis is not to predict the future with certainty, but to evaluate possible paths based on price behavior and Elliott Wave Principle. In the first scenario, the recent upward movement may still be part of a larger corrective structure. In this case, the current rally could be developing as Wave B within a classic Zigzag pattern. If this scenario remains valid, we may expect another downward mby Mehdi_Abbasi_EWP12
 LongLong


 Long
Long
 LongLong
 Long
Long
 Long
Long