$ITC: Got "Sin Taxed" - Capitulation is nearly here.The Technical Setup: Head & Shoulders Completion
ITC has been a textbook example of a structural breakdown. The massive Head and Shoulders top that formed throughout 2024 and 2025 has fully triggered.
The Neckline: The 390 level was the line in the sand; once that snapped, the technical "gravity" took over.
The Log Target: We are currently hovering right around the 301–304 zone, which represents the logarithmic target of that massive top. This is often where "forced selling" ends and "value b
Head and Shoulders
Angel One: Breakout | Target ₹580The wait is over. Angel One (ANGELONE) has spent years building a massive technical base, and the weekly chart is now screaming "Blue Sky Breakout."
Following a classic "Shakeout & Rocket" phase in early 2023, the price action has matured into a textbook Continuation Inverse Head & Shoulders pattern.
We are currently witnessing a high-conviction test of the multi-year neckline at the ₹326–₹330 zone.
Why the setup is prime:
Confirmation Trigger: A solid weekly close above ₹330 invalidates th
MSTR: Don't be Saylor's ATMLooking at the chart comparing MSTR versus the SPX, you are essentially looking at the "Volatility Multiplier" of the crowd's confidence in Michael Saylor.
The ratio between MSTR and the SPX is not a standard correlation; it is a leverage-adjusted signal.
When MSTR outperforms the SPX (the ratio line slopes upward), it confirms that liquidity is flowing into high-beta, Bitcoin proxy-linked assets.
When the ratio flattens or dips, it indicates that the market is "de-risking"—moving back into s
NAS100 |Bullish Inverse Head & Shoulder|Waiting for Confirmation#NASDAQ 100 is developing a Inverse Head & Shoulders pattern on the 1-hour timeframe, indicating that buyers are gradually taking control after a healthy correction.
Technical Overview
Clear Inverse Head & Shoulders formation
Higher lows showing increasing bullish momentum
No significant bearish structure or reversal signal at the moment
Price is approaching the neckline resistance
Trading Plan
I'm not chasing the breakout. The high-probability setup is:
* Wait for a strong breakout above the
BTCUSDT.PPrice remains inside the premium zone but is now trading near its lower boundary after breaking the 1H MSB and flipping the bands bearish. The 1H Order Block continues to hold as support despite multiple tests. Price action is forming lower highs and lower lows, with a potential Head and Shoulders developing, although it is not yet confirmed. Volume has contracted during consolidation, suggesting compression before the next impulsive move. A break below the Order Block would strengthen the beari
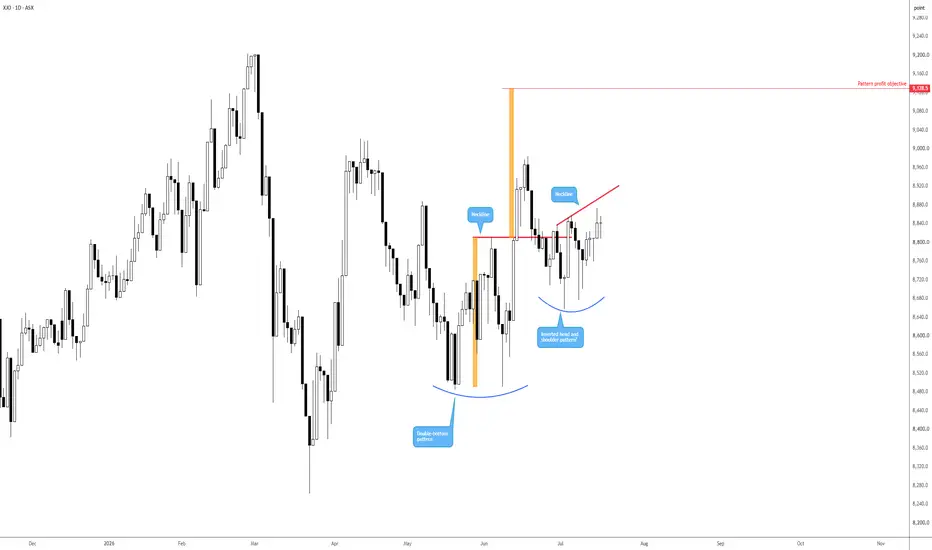
ASX 200 eyeing a pattern breakoutWe have some interesting price action brewing on the ASX 200.
Although a pullback from 8,983 occurred following the break of a double-bottom pattern’s neckline at 8,811, price is beginning to find a footing without breaching the pattern’s lows of around 8,485. The pattern’s profit objective is still calling for attention at 9,128.
Additionally, you may acknowledge the potential inverted head-and-shoulders pattern now forming, with the neckline at 8,900. A break above here may help reaffirm bu
Solana Price Prediction Amid Crypto Bullish OutlookSolana (SOL) is poised to reclaim its $250 all-time high, according to one long-term analysis of the 3-day SOL/USDT higher-timeframe chart.
Solana chart forecasts strong upside momentum to $250
As seen in the chart below, Solana appears to be carving out a robust, long-term accumulation pattern that could catalyze massive upward momentum. The analyst emphasizes “zooming out” to filter out minor market volatility and focus through a macroscopic lens.
At the time of writing, SOL was trading at $
Navin Fluorine – Inverted H&S Breakout SetupSetup: 1‑hour chart showing a Head & Shoulders formation with neckline breakout potential.
Current Price: Around ₹7,800 projection zone.
Trend Context:
Left Shoulder, Head, Right Shoulder clearly defined.
Moving average support aligning with breakout zone.
Long/Short signals marking trader interest.
Why Traders Care:
Head & Shoulders is a classic reversal pattern.
Breakout above neckline often signals strong upside.
Volume confirmation adds conviction to the move.
My Take: Navin Fluorine
ETHUSDT | Potential Breakout Toward $2,260Ethereum is trading near a key technical zone, with an inverse head and shoulders pattern approaching confirmation.
✅ Entry confirmation: 4H candle close above the $1,850 neckline
❌ Invalidation: 4H candle close below the $1,850 neckline
🎯 First resistance: $2,000
🎯 Second resistance: $2,150
🚀 Main target: $2,260
🛑 Stop loss: 4H candle close below $1,750
A confirmed breakout above the neckline would strengthen the bullish setup and could open the way toward $2,000, then $2,150, with the full p
GOLD (XAU/USD): Strong Bullish SignalThe price of 📈Gold formed an inverted head and shoulders pattern on the hourly timeframe, following a test of a significant intraday horizontal support level.
A bullish breakout from the horizontal neckline of this pattern on the hourly chart suggests a clear display of buyer strength.
The target is 4054.
NZD/USD has formed a potential head-and-shoulders bottomOn the daily chart, BTCUSD has stabilized after rebounding from lows, with short-term price action forming a potential "head and shoulders bottom" pattern. Attention should be focused on the resistance near 67,253; a breakout could trigger an upward move. In the short term, look for long-entry opportunities in the 62,000–62,800 zone.
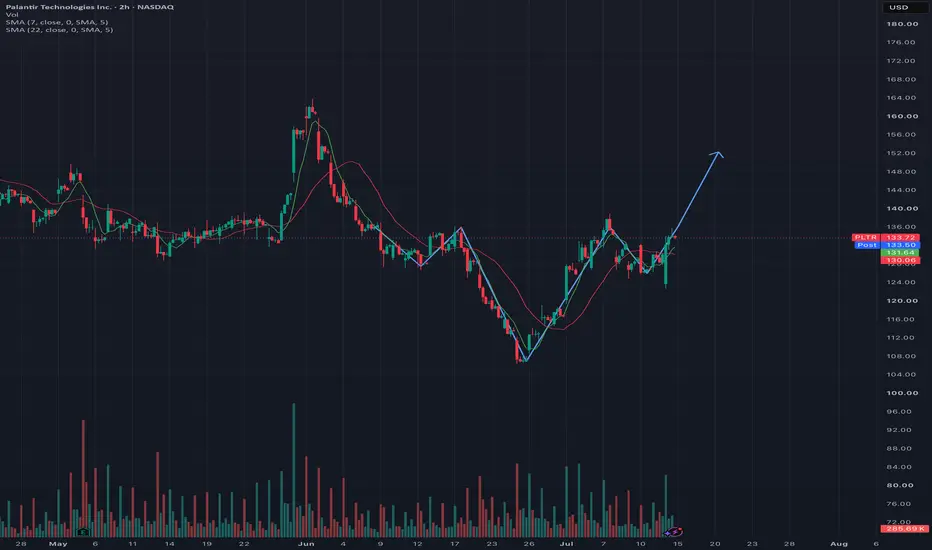
Inverted H&S pattern in PLTRLeft shoulder low: ~$127
Peak between LS and Head (left neckline): ~$136-137
Head low: ~$107
Right shoulder low: ~$128-129
Current price: $134.19 — still inside the pattern, approaching the neckline
The neckline at ~$136-137 has NOT been broken yet. At $134, price is still ~$2-3 below the neckline. So this is still a pending IH&S breakout, not a confirmed one. That's actually more
A 2h close above $137 with above-average volume confirms the pattern.
Neckline ~$136.50, Head low ~$107 → heigh
ZECUSDT | Potential Breakout Toward 800$Zcash (ZEC) is trading at a key technical level, with an inverse head and shoulders pattern taking shape and price approaching a breakout above the neckline at 544.28.
✅ Entry confirmation: 4H candle close above 544.28
🎯 First resistance: 630
🎯 Second resistance: 690
🚀 Main target: 800 — around +46% upside
🛑 Stop loss: 4H candle close below 490 — around -10% risk
Holding above the neckline would turn the 544 area into potential support and could open the way toward 630, then 690, and possibly
ETHEREUM (ETH/USD): Strong Bullish PatternThere is a strong likelihood that 📈ETHEREUM will continue its upward movement.
The formation of an inverted head and shoulders pattern, following a test of a critical support level and a subsequent breakout above its neckline, presents a strong bullish signal.
Our target is 1810.
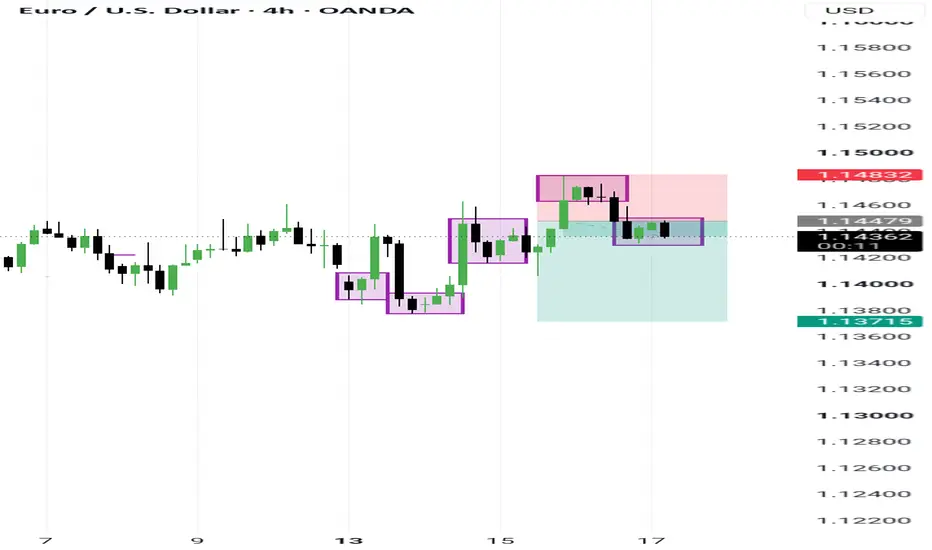
USDCAD: Massive Triple Breakout Complete, the Next Leg UpHi!
This USDCAD setup is looking incredibly bullish after clearing multiple major technical structures at once. We officially have three massive confirmations on the daily chart:
The long-term descending trendline is broken,
The inverse head and shoulders pattern is broken,
And the massive macro double bottom neckline has finally been cleared.
Right now, the price is trading around 1.41290 and starting a healthy correction back down. I'm expecting this short-term pullback to retes
BTC | The Inevitable Collapse of Bitcoin to Sub-$20K | SHORTHISTORY IN THE MAKING: The Inevitable Collapse of Bitcoin to Sub-$20K (And Why Saylor Got It Wrong)
Traders, we are currently witnessing the greatest distribution phase in modern financial history.
With Bitcoin hovering precariously around the $64,000 mark after its staggering collapse from the 2025 highs, the retail crowd is desperately clinging to the hope of a "bull flag" or a "healthy correction." Let me be crystal clear: this is not a dip to be bought. This is the structural unwinding of a
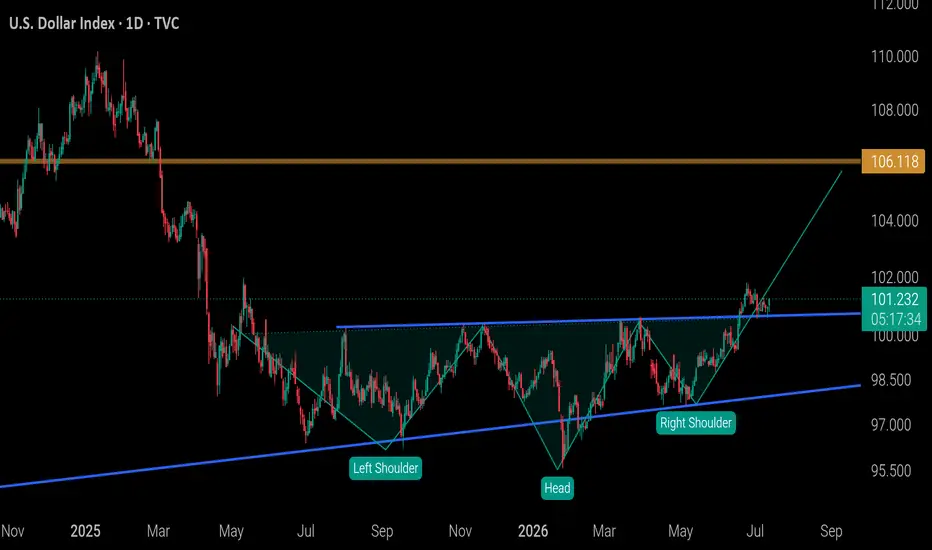
There will be bloodAs demonstrated perfectly by the chart, we're going to have another leg in continuation of the upward trend and DXY will shape a new high. Therefore, will we be seeing something like bloodbath in the markets including stocks and crypto as the dollar gets stronger and you better be on short or sit on your ass wherever you're trading. And, it will take some time, like months or even for some stocks it might be years.
ORCL WorstCase Head&Shoulders BennettCycles TechShortPressureOracle (ORCL) printed a large Head & Shoulders top after the 2024-2025 rally. Left shoulder, head, and right shoulder are clear. The neckline is broken, and the price is accelerating lower.
Worst-case technical scenario
The measured move from the head targets the long-term rising trendline.
If the breakdown holds, the pattern projects significant further downside from current levels.
Statistics
According to Thomas Bulkowski’s research, Head & Shoulders tops reach their full measured mov