AUDNZD: Bearish Move Confirmed 🇦🇺🇳🇿
I think that AUDNZD will retrace from a key daily resistance level.
The price formed a head & shoulders pattern on an hourly time frame
and violated its horizontal neckline.
Goal - 1.2057
❤️Please, support my work with like, thank you!❤️
I am part of Trade Nation's Influencer program and receive a monthly fee for using their TradingView charts in my analysis.
Head and Shoulders
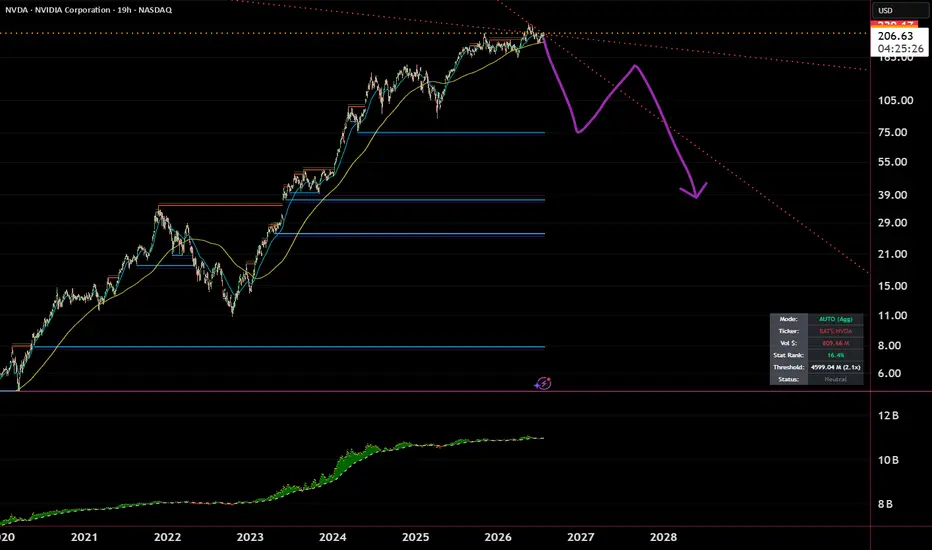
NVDA - "Hi AI! Bye AI!"NASDAQ:NVDA Look at the 19H chart for NVDA. We aren't looking at a dip; we are looking at the completion of a Head and Shoulders top. The market is pricing in the end of the US 'AI Monopoly.' The trade is shifting from 'who has the most expensive chips' to 'who can deploy AI at the lowest cost.'
The US is trying to sanction its way out of competition, but capital is indifferent to DC politics. Look at the $287 billion profit swing in Chinese mutual funds on their own AI binge. That capital is
NVDA: Inverse Head and Shoulders Pattern, Anticipate Breakout!NVIDIA (NVDA) stock is trading around $212 with a market cap of over $5.1 trillion, surging amid growing demand for AI infrastructure. Catalyst news highlights supplier Wistron opening a $700 million Texas factory to build Nvidia AI systems. and Japan's Noetra AI planning to purchase 27,500 Rubin chips. Investors are closely eyeing upcoming Q2 earnings on August 26, 2026, where analysts projects an EPS of $2.07.
Technical Insight:
Stock approaches an important round bottom resistance. This leve
BTCUSD TP 72400-74200On the daily chart, BTCUSD has stabilized at lower levels, and the short-term price action has formed an inverse head-and-shoulders pattern. Attention should be paid to the support provided by the upward trend line; if the price pulls back and stabilizes, further buying could be considered. To the upside, watch the previous supply zone between 72,400 and 74,200.
RBRK: One Breakout Away From Price Discovery?RBRK appears to be setting up for another attempt at its All-Time High near 103 after spending months building a strong bullish base.
Following its rejection from 103, the stock entered a prolonged correction and consolidation phase. That correction has now evolved into a large Inverse Head & Shoulders pattern—one of the most recognized bullish reversal formations.
Adding to the bullish case, price has recently:
✅ Broken Market Structure (BOS)
✅ Broken above the descending trendline resistanc
USDCHF May Rise More! Here is Why: 🇺🇸🇨🇭
USDCHF broke and closed above a horizontal neckline of a huge
inverted head & shoulders pattern on a 4H time frame.
The broken neckline turned into a strong intraday support.
I expect a bullish continuation to 0.8145
❤️Please, support my work with like, thank you!❤️
I am part of Trade Nation's Influencer program and receive a monthly fee for using their TradingView charts in my analysis.
NIFTY 50 | 30-Minute | BTR Swing Analysis | 21 July 26📉 BTR Sell Signal remains active as NIFTY trades below the sell zone.
The market faced rejection near resistance and failed to sustain above the BTR Sell Signal level. Since then, price has been making lower highs, indicating that sellers continue to dominate in the short term.
Trade Setup
🔴 BTR Sell Signal Active
🛡️ Stop Loss: Above 24,367.30
🎯 Target 1: 24,021.95
🎯 Target 2: 23,849.25
🎯 Target 3: 23,676.60
Market Outlook
NIFTY is currently consolidating after the initial decline. As long
LTCUSD BUY 46.0On the daily chart, LTCUSD has formed an inverse head-and-shoulders pattern. Attention should currently be focused on the support level near 46.0; if the price pulls back and stabilizes there, further buying could be considered. To the upside, watch the previous supply zone at 51.0–52.7.
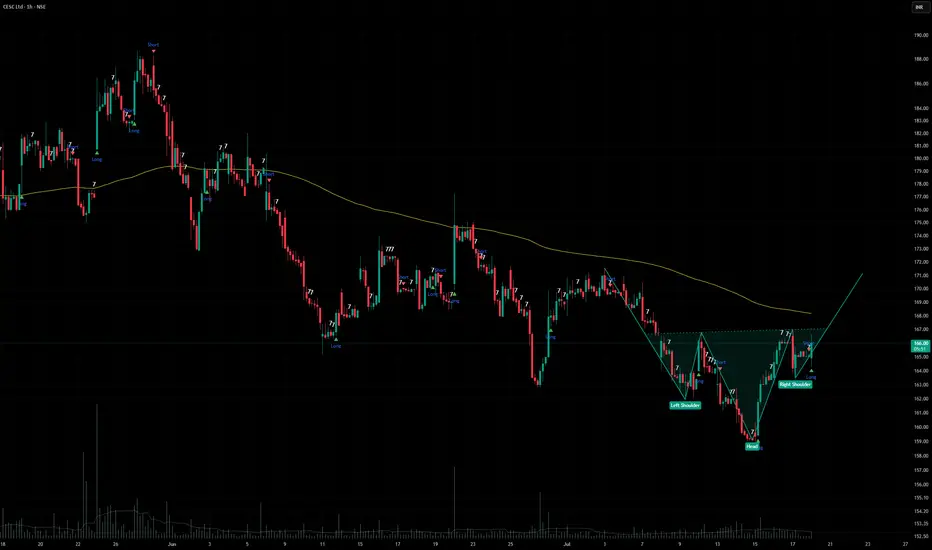
CESC inverted H&S CESC Ltd – Head & Shoulders Reversal Watch
Setup: 1‑hour chart showing a Head & Shoulders formation with neckline in play.
Current Price Zone: ₹158 – ₹190.
Trend Context:
Left Shoulder, Head, Right Shoulder clearly defined.
Moving average providing dynamic support.
Long/Short signals marking trader interest.
Why Traders Care:
Head & Shoulders is a classic reversal pattern.
Break below neckline often signals bearish momentum.
Volume spikes add conviction to whichever side confirms.
My Tak
$APA: Inverse Head & Shoulders Breakout coming soon.APA Corporation ( NASDAQ:APA ) showing a classic Inverse Head and Shoulders pattern, which is a major bullish reversal signal typically found at the end of a downtrend
The "AI-Energy" Narrative: NASDAQ:APA surged over 8% on January 9, 2026, following reports linking increased LNG demand to the massive power needs of AI data centres.
Institutional Support: JPMorgan Chase and other institutions recently increased their stakes, signalling professional confidence in the stock's 2026 prospects.
LTC/USDT (4h) Testing an Inverse Head and Shoulders BreakoutLTC/USDT is testing the neckline of an inverse head and shoulders pattern on the 4H chart, signaling a potential bullish reversal.
A confirmed close above the 46.40 USDT neckline could open the way toward the measured target near 53.70 USDT. Rejection and a move back below the neckline would weaken the setup, while losing the right-shoulder area would invalidate it.
I'm worried for BIT DIGITAL. It can lose -75% of share value. At 50 cents
Bit Digital would be prices as a distressed, option like stub on #crypto and #AI
Rather than a normal business.
A coherent. bear case says it deserves that treatment.
Why?
1. Hyper cyclical BTC linked business model
2. Regulatory and political overhang on mining/crypto
3. Execution risk in the HPC/AI pivot story.
4. Balance sheet and cash flow vulnerability.
5. Narrative fatigue and sentiment risk.
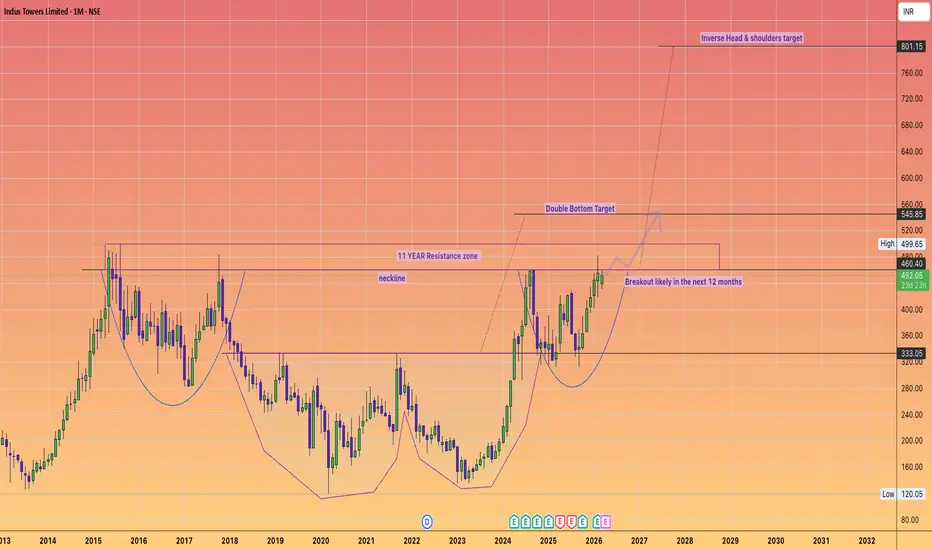
$INDUSTOWER: From "Debt Trap" to Growth King?🚀💎
Is NSE:INDUSTOWER a solid Double play for the next 18 months?
While many have ignored it, the fundamentals have quietly shifted from "Survive" to "Thrive."
Here’s why the 2x move is on the table:
1. The Vi "Resurrection" 📈Forget the old drama.
Vodafone Idea (Vi) is no longer a liability—it's a growth engine.Debt Fixed:
Vi’s 16-year debt freeze means they finally have cash to pay Indus.
No Overdues: Management confirmed zero pending payments from Vi in Q3.
New Business: Vi’s ₹45,000
$ITC: Got "Sin Taxed" - Capitulation is nearly here.The Technical Setup: Head & Shoulders Completion
ITC has been a textbook example of a structural breakdown. The massive Head and Shoulders top that formed throughout 2024 and 2025 has fully triggered.
The Neckline: The 390 level was the line in the sand; once that snapped, the technical "gravity" took over.
The Log Target: We are currently hovering right around the 301–304 zone, which represents the logarithmic target of that massive top. This is often where "forced selling" ends and "value b
Angel One: Breakout | Target ₹580The wait is over. Angel One (ANGELONE) has spent years building a massive technical base, and the weekly chart is now screaming "Blue Sky Breakout."
Following a classic "Shakeout & Rocket" phase in early 2023, the price action has matured into a textbook Continuation Inverse Head & Shoulders pattern.
We are currently witnessing a high-conviction test of the multi-year neckline at the ₹326–₹330 zone.
Why the setup is prime:
Confirmation Trigger: A solid weekly close above ₹330 invalidates th
MSTR: Don't be Saylor's ATMLooking at the chart comparing MSTR versus the SPX, you are essentially looking at the "Volatility Multiplier" of the crowd's confidence in Michael Saylor.
The ratio between MSTR and the SPX is not a standard correlation; it is a leverage-adjusted signal.
When MSTR outperforms the SPX (the ratio line slopes upward), it confirms that liquidity is flowing into high-beta, Bitcoin proxy-linked assets.
When the ratio flattens or dips, it indicates that the market is "de-risking"—moving back into s
NAS100 |Bullish Inverse Head & Shoulder|Waiting for Confirmation#NASDAQ 100 is developing a Inverse Head & Shoulders pattern on the 1-hour timeframe, indicating that buyers are gradually taking control after a healthy correction.
Technical Overview
Clear Inverse Head & Shoulders formation
Higher lows showing increasing bullish momentum
No significant bearish structure or reversal signal at the moment
Price is approaching the neckline resistance
Trading Plan
I'm not chasing the breakout. The high-probability setup is:
* Wait for a strong breakout above the