先に進む準備が出来るまで無料
マーケット全体がどう動いているかをまず最初に見てみましょう。
そして、100,000,000人が利用するプラットフォームから、そこへに飛び込んでいきましょう。
クレジットカードは必要ありません
あらゆるレベルの野心に応えるプラン
世界のマーケットをあなたの手に
弊社では信頼性の高い何百ものデータフィードへの接続を皆様に提供しています。世界中の3,539,722銘柄のデータに直接アクセス可能で、プロも利用する機関レベルのデータパートナーから得た高品質な情報がその源です。
プランの比較
| Basic | Essential | Plus | Premium | Ultimate |
|---|
チャート | Basic | Essential | Plus | Premium | Ultimate |
|---|---|---|---|---|---|
タブごとのチャート | 1 | 2 | 4 | 8 | 16 |
Saved chart layouts | 1 | 5 | 10 | ||
Custom chart intervals | |||||
Predefined second intervals | |||||
Custom second intervals | |||||
ティックベースの時間足 | |||||
Intraday price-based charts | |||||
Custom range bars | |||||
Spread charts | |||||
データのエクスポート | |||||
カスタマイズ可能なチャートタイプ | 17 | 17 | 17 | 21 | 21 |
Symbol comparison | |||||
配当調整済チャート | |||||
Interactive corporate events and news | |||||
Historical annual financial data | 7年 | 20年 | 20年 | 20年 | 20年 |
Historical quarterly financial data | 8年 | 8年 | 8年 | 8年 | 8年 |
時間外取引 | |||||
Parallel chart connections | 2 | 10 | 20 | 50 | 200 |
入れ子になった描画グループ | |||||
| Bar replay | |||||
日足以上の過去データ | すべて | すべて | すべて | すべて | すべて |
分足の過去データ | 180日 | 365日 | すべて | すべて | |
秒足の過去データ | すべて | すべて | |||
ティックの過去データ | 7日 | ||||
Indicators replay | |||||
Trading in bar replay | |||||
| テクニカル分析 | |||||
400以上の人気の内蔵インジケーター | |||||
150K+ community-powered indicators | |||||
Indicators on indicators | 1 | 1 | 9 | 24 | 49 |
チャートごとのインジケーター | 2 | 5 | 10 | 25 | 50 |
チャートごとの財務指標 | 1 | 4 | 7 | 10 | 25 |
カスタムインジケーターテンプレート | 1 | ||||
110+ drawing tools | |||||
出来高ローソク足 | |||||
Pine Script® | |||||
ローソク足パターンの検出 | |||||
オート・フィボナッチ・リトレースメント | |||||
マルチタイムフレーム分析 | |||||
計算時間の制限 | 20 sec | 40 sec | 40 sec | 40 sec | 100 sec |
オート・チャートパターン | |||||
| Orderflow | |||||
Volume profile indicators | |||||
Time price opportunity | |||||
出来高フットプリント | |||||
| Strategy backtesting | |||||
基本的なレポート指標 | |||||
高度なレポート指標 | |||||
Export trades in CSV | |||||
レポートをXLSXでエクスポート | |||||
ディープバックテスト | |||||
High detalization of historical bars | |||||
ヒストリカルティックごとの実行 | |||||
| ウォッチリスト | |||||
ウォッチリストの数 | 1 | ||||
ウォッチリストごとのシンボル | 30 | 1,000 | 1,000 | 1,000 | 1,000 |
フラグシンボルの色 | 1 | 7 | 7 | 7 | 7 |
Import and export | |||||
カスタム列・ソート | |||||
| ポートフォリオ | |||||
ポートフォリオの数 | 1 | 3 | 4 | 5 | 7 |
ポートフォリオごとの銘柄数 | 20 | 50 | 75 | 100 | 150 |
ポートフォリオごとの取引数 | 2,000 | 5,000 | 5,000 | 5,000 | 5,000 |
Plaid経由のブローカー口座接続 | 3 | 3 | 3 | 3 | |
| アラート | |||||
稼働中の価格アラート | 3 | 20 | 100 | 400 | 1,000 |
Active technical alerts | 20 | 100 | 400 | 1,000 | |
稼働中のウォッチリストアラート | 2 | 15 | |||
Alert duration | 1 month | 2 months | 2 months | ||
Webhook 通知 | |||||
複数条件アラート | |||||
Alerts on financial metrics | |||||
秒足アラート | |||||
| スクリーナー | |||||
Stock, ETF, bond, crypto screeners | |||||
50カ国以上、150以上の取引所 | |||||
500以上のファンダメンタル・テクニカル指標 | |||||
複数の市場 | |||||
チャートビューモード | |||||
ウォッチリストでフィルタリング | |||||
AI Screener requests | Preset requests only | 100 | 150 | 250 | 500 |
フラグシンボルの色 | 1 | 7 | 7 | 7 | 7 |
Auto-refresh | 10 sec / 1 min | 10 sec / 1 min | 10 sec / 1 min | 10 sec / 1 min | |
データのエクスポート | |||||
時間足 | D W M | すべて | すべて | すべて | すべて |
Pineスクリーナー | |||||
債券スクリーナー | |||||
Saved screens | 1 | ||||
Active filters | 2 | ||||
Manual filter setup | |||||
Adding columns | |||||
Custom grid in chart view | |||||
Date range selection in chart view | |||||
| データ | |||||
最速データ配信 | |||||
市場データ購読の上限数 | 2 | 4 | 6 | ||
Ability to buy professional market data | |||||
利用可能な過去バー | 5K | 10K | 10K | 20K | 40K |
Fundamental stock data | |||||
世界経済データ | |||||
Unlimited access to all news sources | |||||
ホットリスト | |||||
Economic, IPO, earnings, and dividend calendars | |||||
Yield Curves | |||||
| トレーディング | |||||
Trading through selected brokers | |||||
デモ (ペーパー) トレード | |||||
チャートトレード | |||||
Depth of market (DOM) trading | |||||
開催中のコミュニティコンテスト | 3 | 5 | 10 | 25 | |
公開コンテストの作成 | |||||
| オプション | |||||
Number of strategies | 3 | 8 | 15 | 25 | |
| SNS | |||||
ユーザー名の横に限定バッジを表示 | |||||
Signature and website fields | |||||
Posting invite-only indicators | |||||
Posting protected scripts | |||||
Posting public ideas and scripts | |||||
Posting video ideas | |||||
Posting minds | |||||
Commenting on public ideas and scripts | |||||
| 広告なし | |||||
チャート | |||||
ソーシャルネットワーク | |||||
| モバイルアプリ | |||||
いつでも指先ひとつで | |||||
Fully synced | |||||
アラートのネイティブプッシュ通知 | |||||
Android and iOS widgets | |||||
| デスクトップアプリ | |||||
デスクトップ環境 | |||||
ネイティブ・マルチモニターサポート | |||||
ウインドウ間のタブリンク (シンボル同期) | |||||
| サポート | |||||
カスタマーサポート | Regular | Priority | Priority | First priority |
どの街でも
弊社の製品は、どの街やどの都市でも、ありとあらゆる場所で利用されています。これほどのレベルで運用されていれば、そのデータも間違いなく最高品質 ― ぜひご自身でお確かめください。
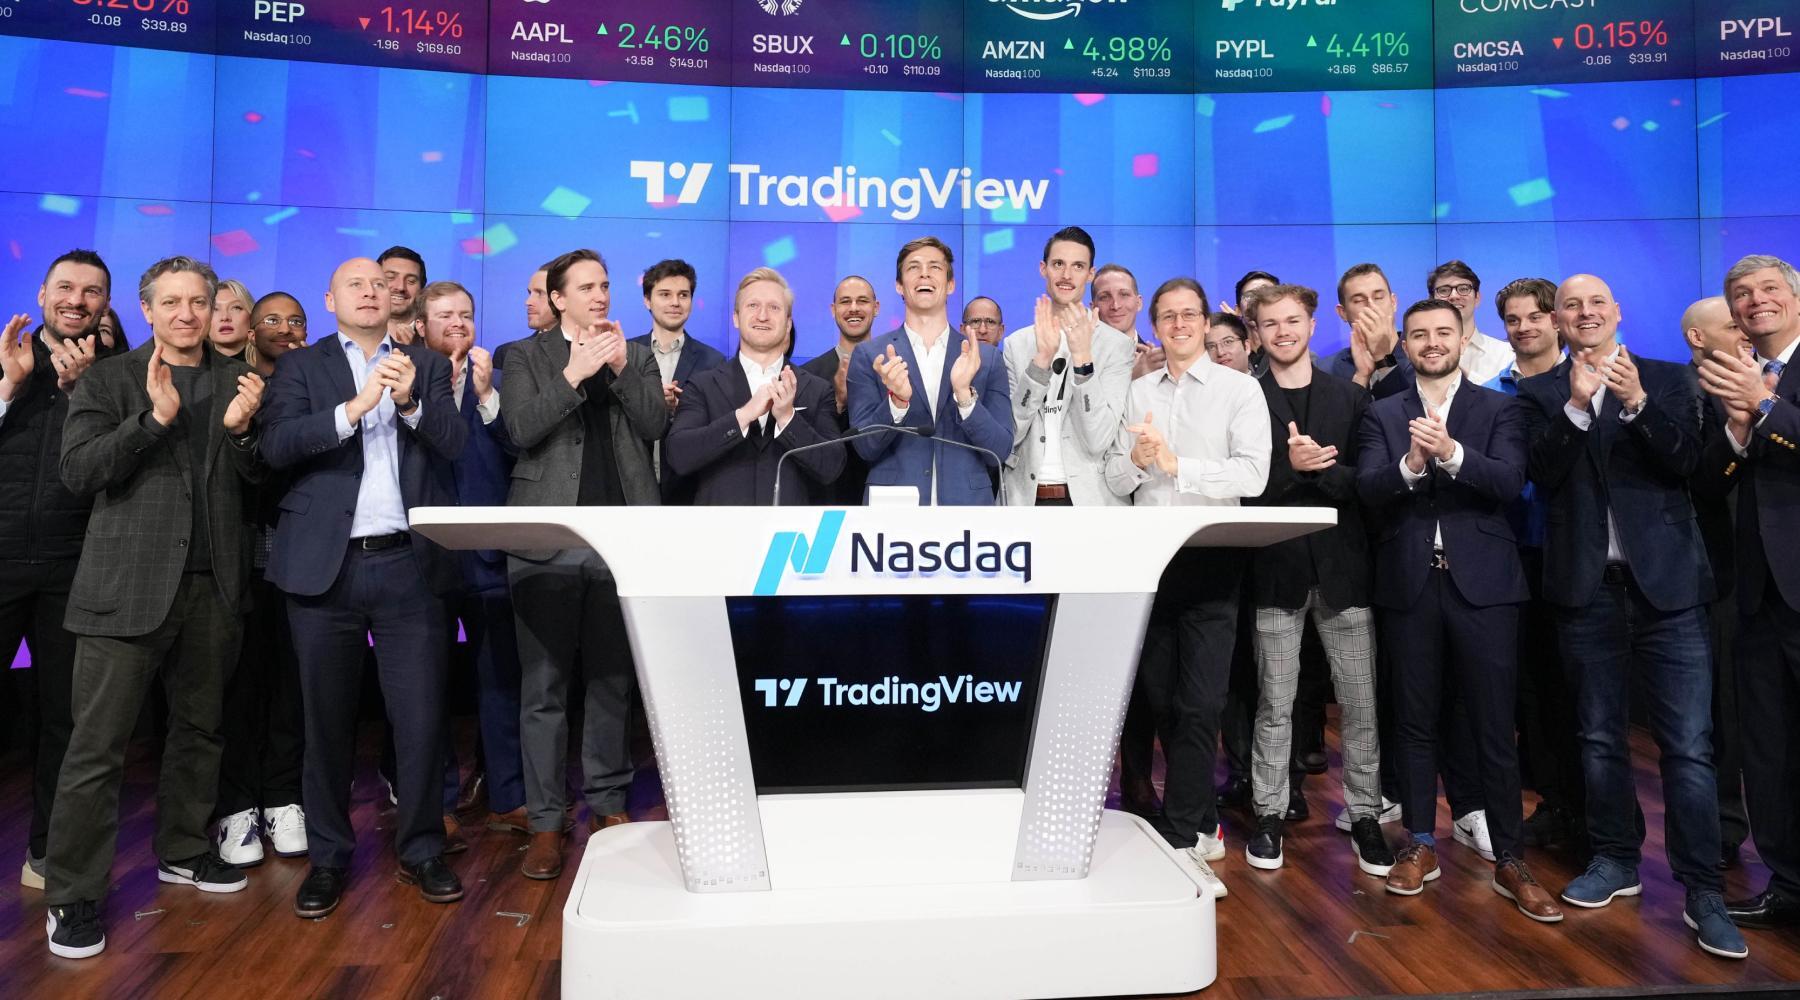
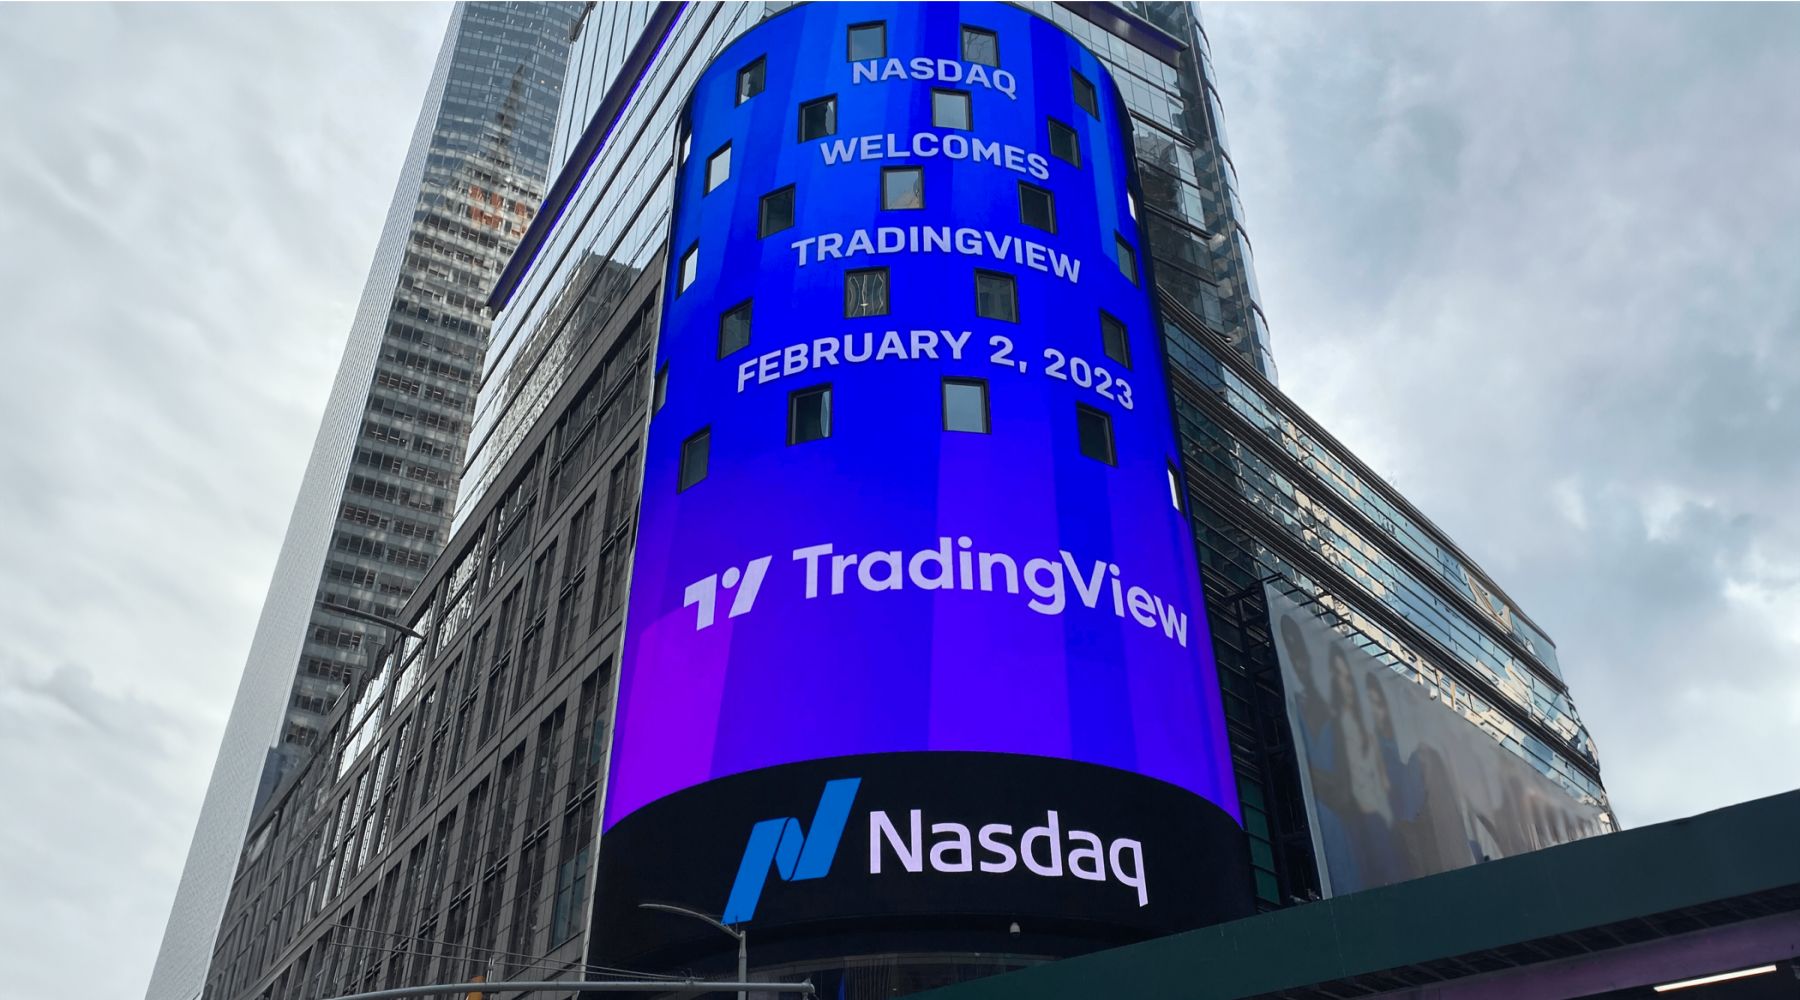
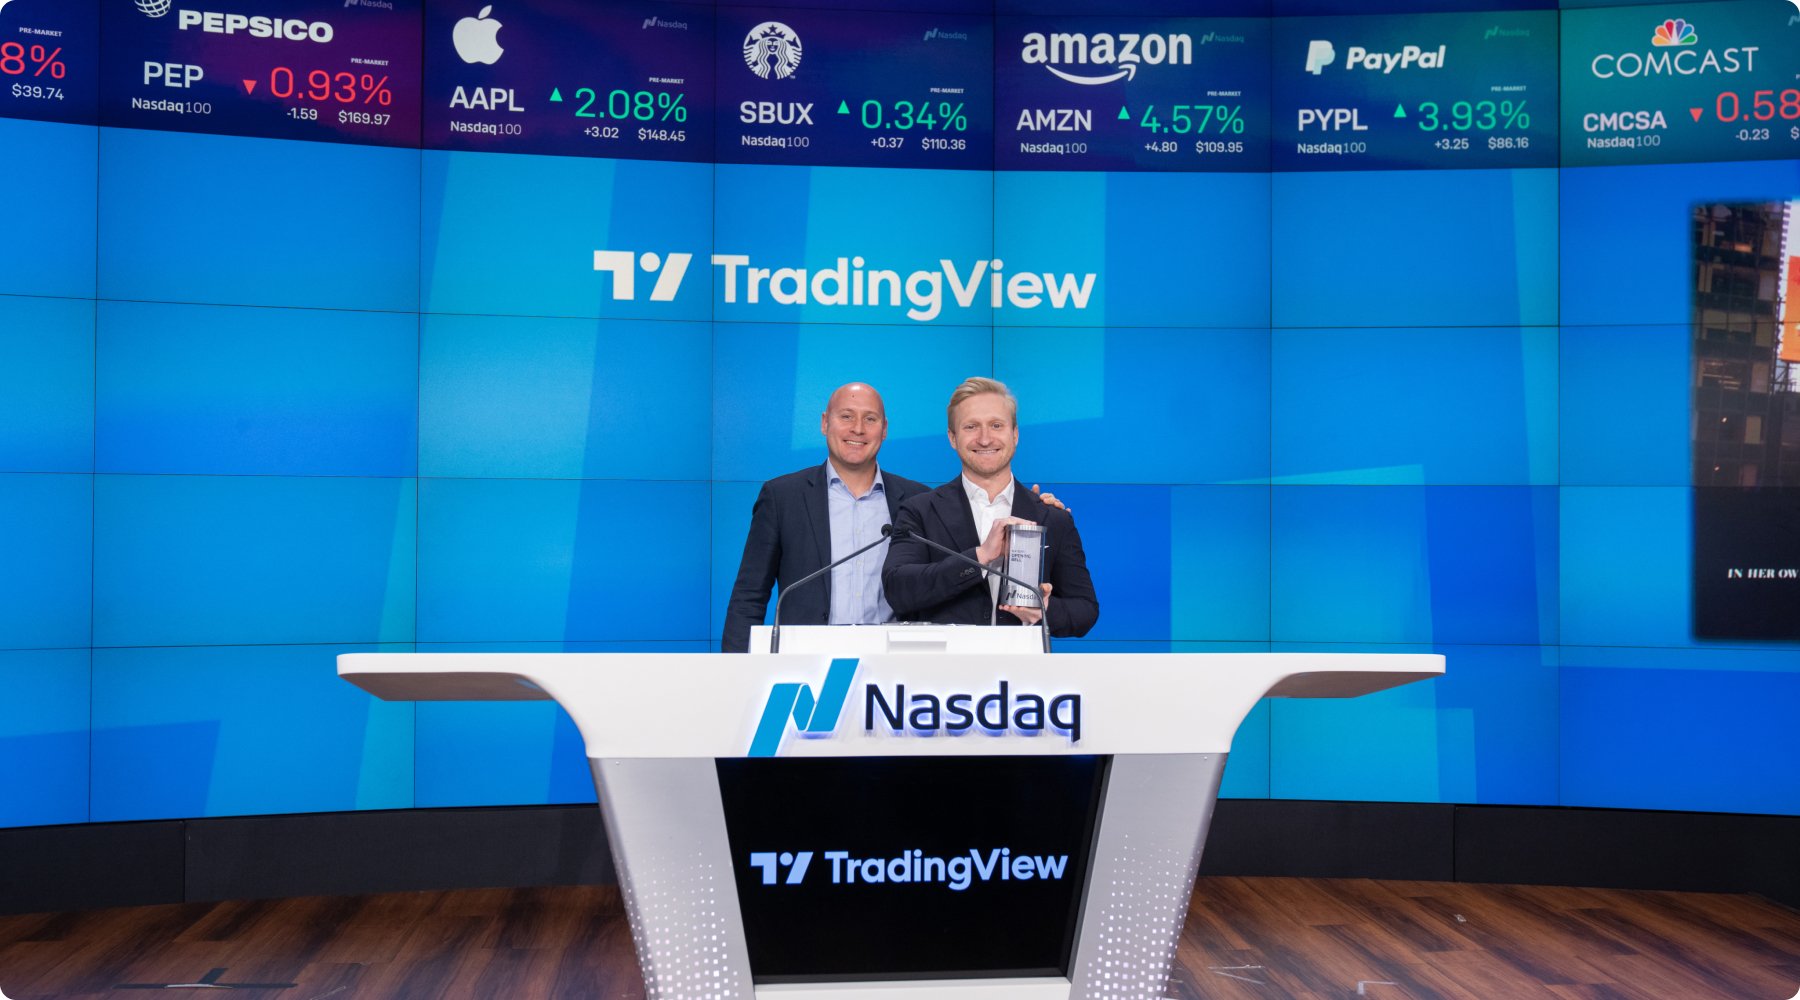
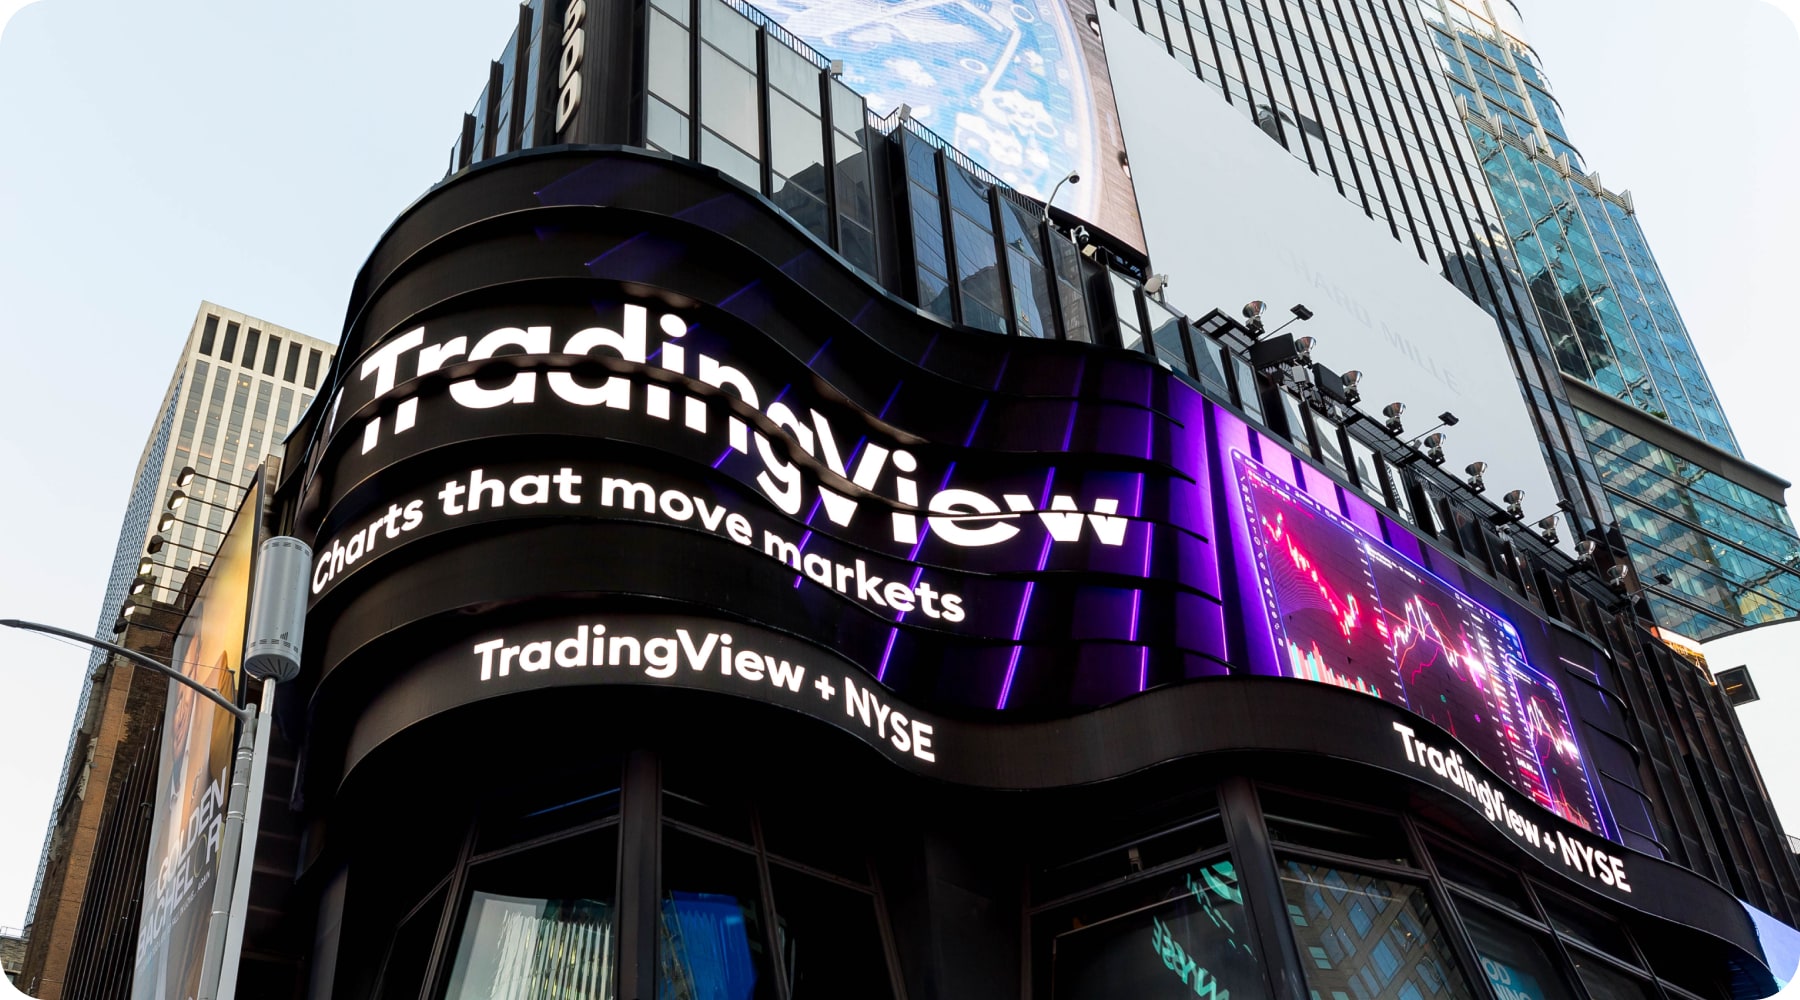
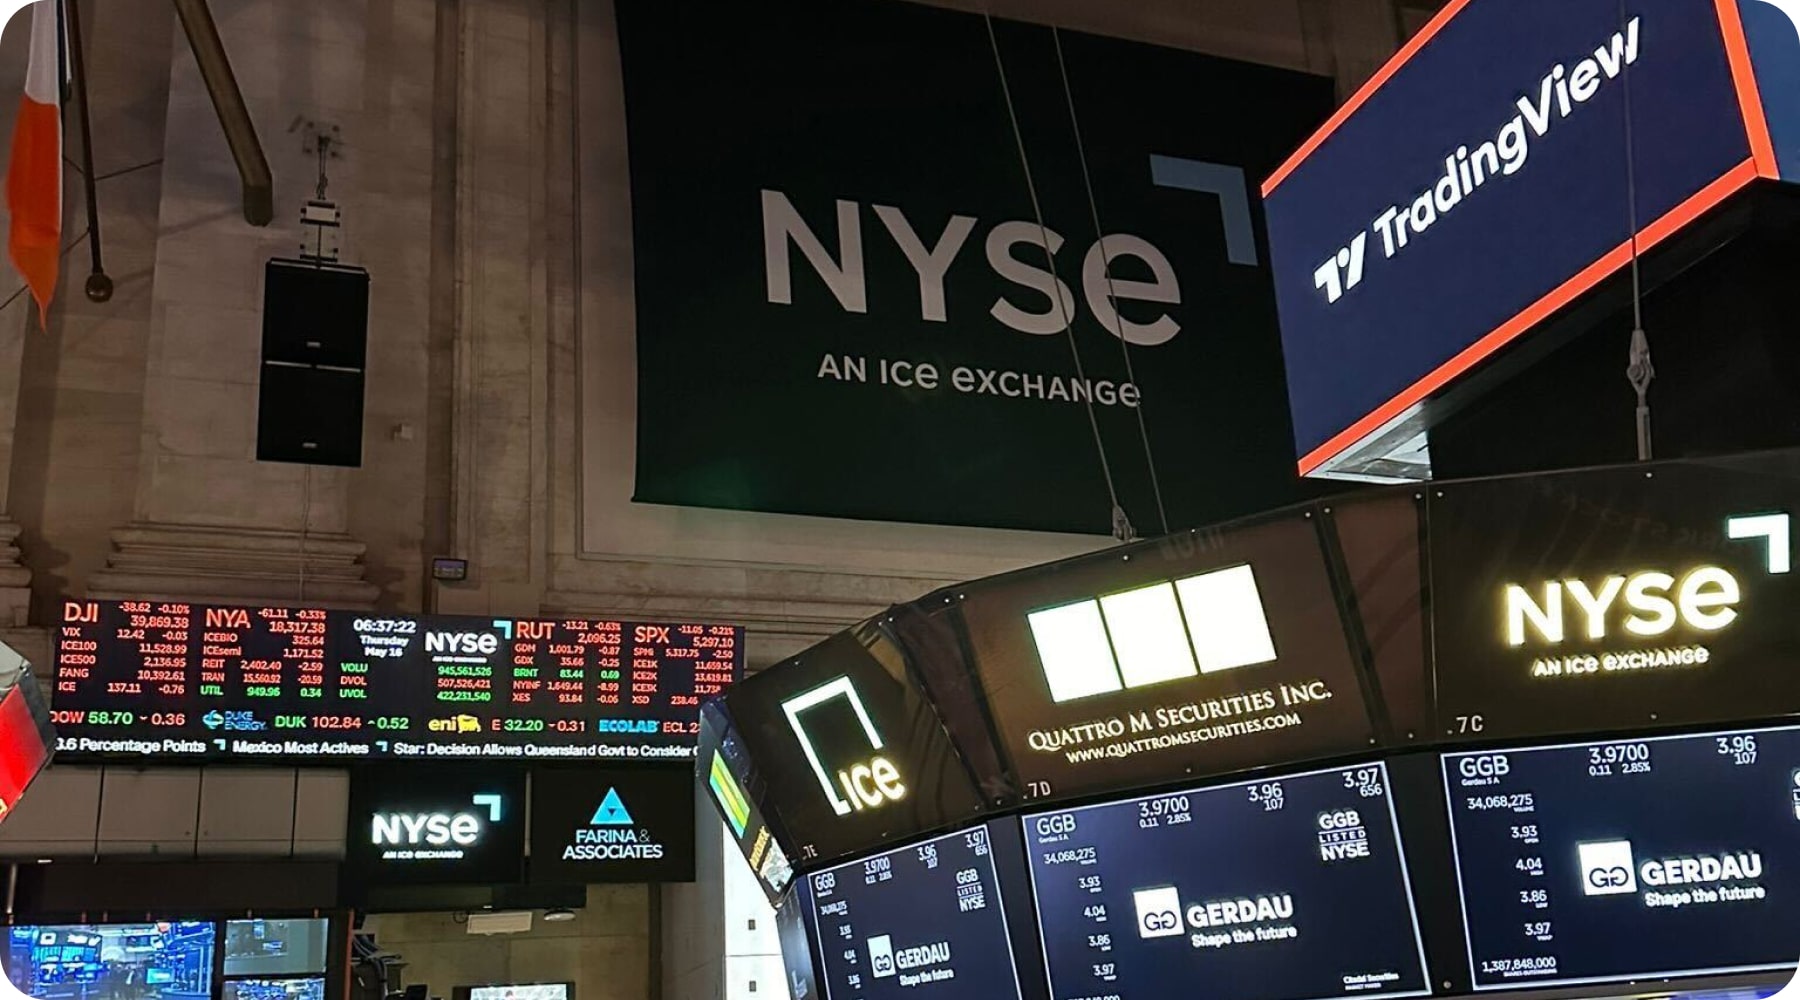
ウォール街よ、こんにちは✌️
一流の情報を手にすることで、トレーダーが見る世界は大きく違ってきます。だからこそ弊社は、世界で最も有名な街からその遥か先まで、最有力の機関とデータパートナーとの提携を結んでいます。
どのデバイスでも
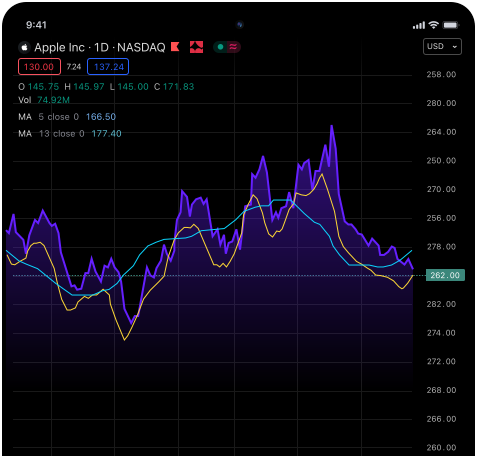
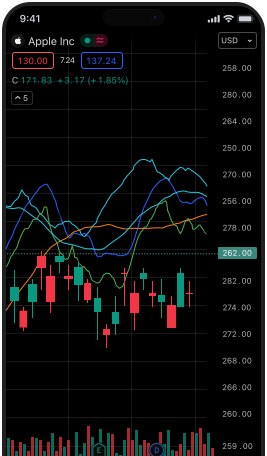
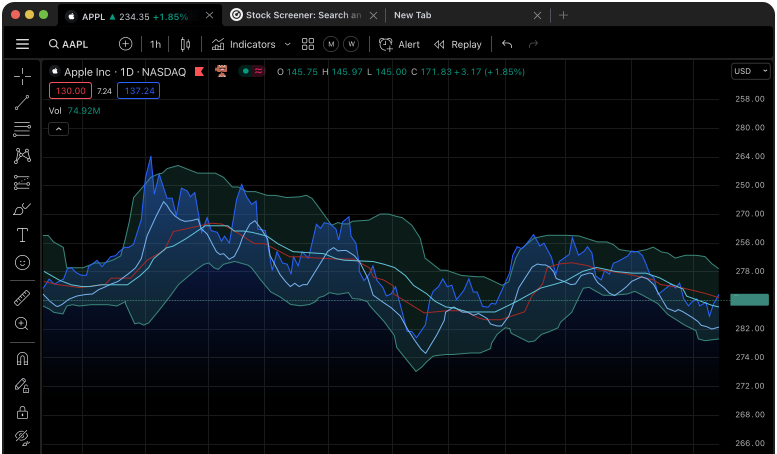
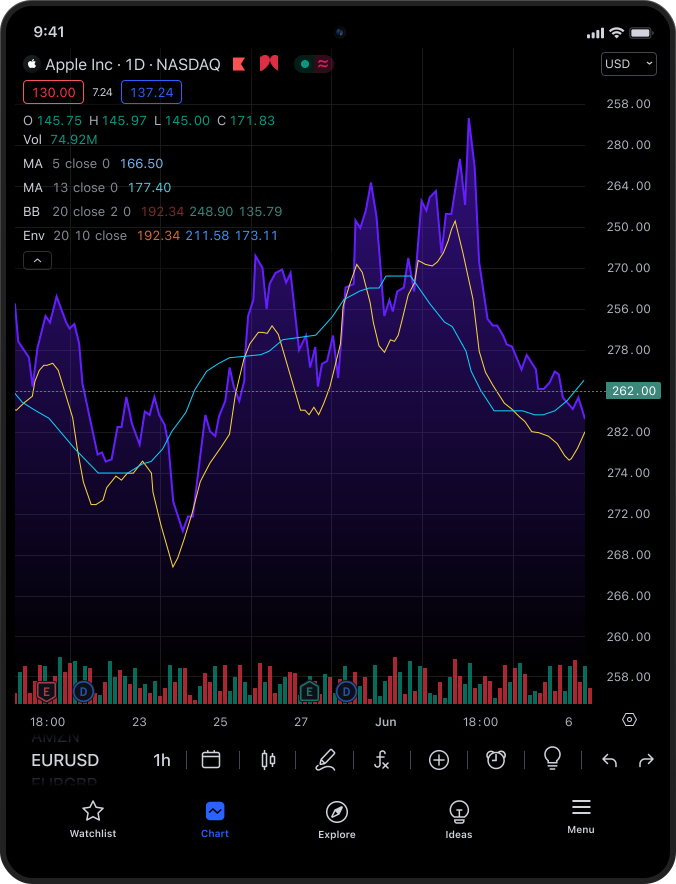
利便性を追求したトレード環境 — レイアウト、ウォッチリスト、各種設定が完全に同期。ウェブ、モバイル、デスクトップアプリ — どのデバイスを使っていても、最善の方法で分析が可能です。







よくあるご質問
はい — 支払時の情報については安全が確保されています。TradingViewではあなたの支払情報を一切保存しません。支払情報は安全に暗号化され、Braintree(PayPalの傘下企業)、Checkout、Razorpay、dLocal、Triple-Aなどの決済業者のAPI経由で直接送信されます。これらのセキュア接続により、安全で簡単かつ信頼性の高いサブスクリプションの管理が保証されます。
ご利用いただけるお支払い方法としては、主要なクレジットカードすべて、PayPalアカウント、Apple Pay、暗号資産による決済があります。さらに、弊社のモバイルアプリでは、App StoreまたはGoogle playでサポートされているお支払い方法であれば、すべてご利用いただけます。
はい、月額プランと年間プランの両方で暗号資産によるお支払いが可能です。直接もしくはBinance Pay経由でのお支払いのいずれかを選択できます。支払情報はTriple-Aによって安全に処理されます。暗号資産でお支払いの場合は注文ページで「暗号資産」タブを選択して画面の指示にしたがってください。
サブスクリプションはいつでもキャンセルが可能で、現在の有料期間が終了した後も自動更新はされません。有効期間中は有料サービスがご利用いただけます。トライアルをキャンセルされた場合は、キャンセル後ただちにトライアルが停止されます。
返金は、年間プランのお支払いに対してのみ、支払完了後、暦日で14日以内に申請した場合に限り可能です。返金を申請するには、当社サポートチームに連絡する必要があります。上位プランへのアップグレード、月額プラン、市場データについては、支払完了日当日にサブスクリプションをキャンセルした場合でも、返金は不可です。チャージバック・紛争の申請、またはクレームの申し立てを行ったユーザーは、返金の対象外となりますのでご注意ください。
年間プランは追加の支払いなしでいつでもアップグレード可能です。現在のプランの残り日数は、自動的に新しいプランと同等の価値を持つ日数へと換算されます。失うものは何もありません。残りの日数を利用して、より良いプランに切り替えるだけです。これによりプランの残存期間が短縮され、次の支払い日が変更されます。年間プランのアップグレード方法はこちらをご覧ください。
プランをダウングレードした場合、現在のプランは期限までそのまま維持されます。そして、期限切れになった時点で今回ダウングレードしたプランの料金が適用されます。プランをダウングレードする方法はこちらをご覧ください。
NASDAQ、NYSE、NYSE ARCA、OTC、CMEなど、追加可能なリアルタイムおよび日中取引データについては、すべてご自身のアカウントに個別に追加することができます。データを追加するには、まず弊社の有料プランのいずれかをご利用いただくか、トライアルプランのメンバーであることが必要です。世界の市場データを探索してみましょう。
いいえ。追加のリアルタイムデータをご利用いただけるのは、TradingViewの有料アカウントで対象の取引所からデータを購入したユーザーに限られており、データの閲覧はTradingViewのウェブサイト上のみとなっています。