OPEN-SOURCE SCRIPT
Luminous Volume Flow Oscillator [Pineify]
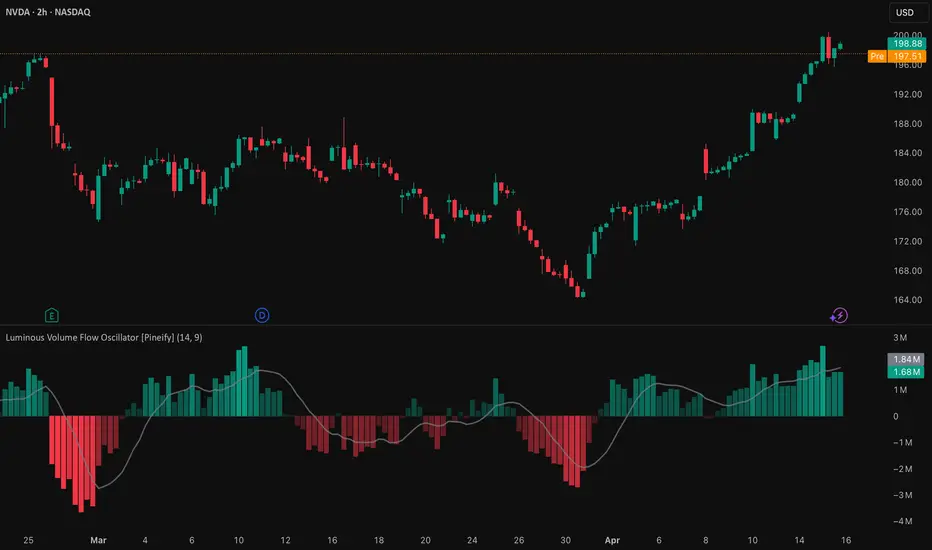
Luminous Volume Flow Oscillator [Pineify]
This indicator splits each bar's volume into buying and selling pressure using bar polarity — where the close sits within the high-low range — then smooths the net delta into a flowing oscillator. Unlike simple up/down volume counters that only compare close vs. open, bar polarity captures intrabar conviction: a close near the high with heavy volume tells a different story than a close near the midpoint. The result is a momentum-style oscillator driven by volume direction rather than price alone.
Key Features
How It Works
The calculation starts by classifying each bar's directional bias. If the close is closer to the high than the low — meaning (close − low) > (high − close) — the bar is considered buyer-dominated and the full volume is assigned as buying pressure. The inverse applies for seller-dominated bars. When the close position is ambiguous, the indicator falls back to a simple close-vs-open check.
How the Components Work Together
The bar-polarity classification acts as the first filter: it determines who controlled the bar. The EMA smoothing then reveals the underlying trend in volume direction by stripping out random fluctuations. On top of this, the signal line provides timing — when the oscillator crosses the signal line, it suggests a shift in volume momentum direction.
The zone filter ties everything together. Buy signals require the oscillator to be below zero (net selling territory) when the bullish crossover occurs. This means you're catching potential reversals where selling pressure is already dominant but starting to weaken — not chasing after volume momentum is already extended. Sell signals work in reverse, firing only when the oscillator is above zero and bearish momentum starts to take over.
Trading Ideas and Insights
Note that bar-polarity volume splitting is an approximation — it doesn't use actual tick-level order flow data. During low-volume or choppy sessions, the oscillator can produce noise even after EMA smoothing. Combine with price structure or trend context for better results.
Unique Aspects
How to Use
Customization
Conclusion
The Luminous Volume Flow Oscillator turns raw volume into a directional momentum reading by splitting each bar's volume according to where price closed within its range. The zone-filtered signal approach keeps entries focused on inflection points rather than chasing extended moves. It works best as a confirmation tool alongside price action or trend-following methods — volume tells you the conviction behind a move, but never the whole story on its own.
This indicator splits each bar's volume into buying and selling pressure using bar polarity — where the close sits within the high-low range — then smooths the net delta into a flowing oscillator. Unlike simple up/down volume counters that only compare close vs. open, bar polarity captures intrabar conviction: a close near the high with heavy volume tells a different story than a close near the midpoint. The result is a momentum-style oscillator driven by volume direction rather than price alone.
Key Features
- Bar-polarity volume splitting that goes beyond basic open/close comparison
- EMA-smoothed volume delta oscillator with dynamic gradient coloring
- Signal line crossovers filtered by oscillator zone — buy signals only fire below zero, sell signals only above
- Adaptive color intensity that scales to recent volume momentum range
How It Works
The calculation starts by classifying each bar's directional bias. If the close is closer to the high than the low — meaning (close − low) > (high − close) — the bar is considered buyer-dominated and the full volume is assigned as buying pressure. The inverse applies for seller-dominated bars. When the close position is ambiguous, the indicator falls back to a simple close-vs-open check.
- Volume is split into buying (upVol) and selling (dnVol) components based on bar polarity
- The raw volume delta (upVol − dnVol) is calculated — positive means net buying, negative means net selling
- An EMA smooths the delta to filter out single-bar noise, producing the main oscillator line
- A simple moving average of the smoothed delta creates the signal line for crossover detection
How the Components Work Together
The bar-polarity classification acts as the first filter: it determines who controlled the bar. The EMA smoothing then reveals the underlying trend in volume direction by stripping out random fluctuations. On top of this, the signal line provides timing — when the oscillator crosses the signal line, it suggests a shift in volume momentum direction.
The zone filter ties everything together. Buy signals require the oscillator to be below zero (net selling territory) when the bullish crossover occurs. This means you're catching potential reversals where selling pressure is already dominant but starting to weaken — not chasing after volume momentum is already extended. Sell signals work in reverse, firing only when the oscillator is above zero and bearish momentum starts to take over.
Trading Ideas and Insights
- When the oscillator crosses above the signal line while below zero, it may indicate that selling pressure is exhausting and buyers are stepping in — consider this a potential early reversal signal rather than a confirmed trend change
- Divergence between price making new highs and the oscillator failing to do so can flag weakening conviction behind the move
- The histogram gradient intensity provides a quick visual read: deep, saturated colors mean strong directional volume; faded colors suggest the move is losing participation
Note that bar-polarity volume splitting is an approximation — it doesn't use actual tick-level order flow data. During low-volume or choppy sessions, the oscillator can produce noise even after EMA smoothing. Combine with price structure or trend context for better results.
Unique Aspects
- Bar polarity is a more nuanced volume classification than simple candle direction. A bullish candle with its close near the midpoint gets less credit than one closing near the high — this distinction matters in real markets where wicks tell the story
- The zone-filtered signal approach acts as a built-in mean-reversion guard. Rather than generating signals at momentum extremes (where risk/reward deteriorates), it targets the inflection zone where directional volume is shifting
- Dynamic gradient scaling using a 100-bar lookback means the color intensity adapts to recent conditions — a moderate reading in a low-volatility period still shows up clearly
How to Use
- Add the indicator to your chart. The histogram shows the smoothed volume delta — bars above zero indicate net buying pressure, below zero net selling
- Watch for the gray signal line crossovers. A crossover while the histogram is below zero is a potential buy setup; a crossunder while above zero is a potential sell setup
- Use the gradient color intensity as a confidence gauge — stronger colors mean more decisive volume flow in that direction
- Set up alerts for automated notifications when buy or sell conditions trigger
Customization
- Volume Smoothing Length (default: 14) — Controls how much the raw volume delta is smoothed. Higher values produce a calmer oscillator but introduce more lag; lower values are more responsive but noisier
- Signal Line Length (default: 9) — Sets the SMA period for the signal line. Shorter lengths generate more frequent crossovers; longer lengths filter out minor fluctuations
- Bullish / Bearish Color — Customize the gradient palette for positive and negative volume flow
- Show Signals / Histogram / Signal Line — Toggle individual visual components on or off to declutter the chart
Conclusion
The Luminous Volume Flow Oscillator turns raw volume into a directional momentum reading by splitting each bar's volume according to where price closed within its range. The zone-filtered signal approach keeps entries focused on inflection points rather than chasing extended moves. It works best as a confirmation tool alongside price action or trend-following methods — volume tells you the conviction behind a move, but never the whole story on its own.
オープンソーススクリプト
TradingViewの精神に則り、このスクリプトの作者はコードをオープンソースとして公開してくれました。トレーダーが内容を確認・検証できるようにという配慮です。作者に拍手を送りましょう!無料で利用できますが、コードの再公開はハウスルールに従う必要があります。

🚀🚀🚀 Pineify - pineify.app
Essential Toolkit for Every Trader
- AI Pine Script Generator
- Finance AI Agent
- AI Stock Picker
- Pine Script Visual Editor
- Invited indicators
- Strategy Optimizer
- Trading Journal
- Backtest Report
Essential Toolkit for Every Trader
- AI Pine Script Generator
- Finance AI Agent
- AI Stock Picker
- Pine Script Visual Editor
- Invited indicators
- Strategy Optimizer
- Trading Journal
- Backtest Report
免責事項
これらの情報および投稿は、TradingViewが提供または承認する金融、投資、取引、またはその他の種類の助言もしくは推奨であることを意図したものではなく、またこれらに該当するものでもありません。詳細は利用規約をご覧ください。
オープンソーススクリプト
TradingViewの精神に則り、このスクリプトの作者はコードをオープンソースとして公開してくれました。トレーダーが内容を確認・検証できるようにという配慮です。作者に拍手を送りましょう!無料で利用できますが、コードの再公開はハウスルールに従う必要があります。
🚀🚀🚀 Pineify - pineify.app
Essential Toolkit for Every Trader
- AI Pine Script Generator
- Finance AI Agent
- AI Stock Picker
- Pine Script Visual Editor
- Invited indicators
- Strategy Optimizer
- Trading Journal
- Backtest Report
Essential Toolkit for Every Trader
- AI Pine Script Generator
- Finance AI Agent
- AI Stock Picker
- Pine Script Visual Editor
- Invited indicators
- Strategy Optimizer
- Trading Journal
- Backtest Report
免責事項
これらの情報および投稿は、TradingViewが提供または承認する金融、投資、取引、またはその他の種類の助言もしくは推奨であることを意図したものではなく、またこれらに該当するものでもありません。詳細は利用規約をご覧ください。