アップデート済
QQQ Momentum Complete 4.31
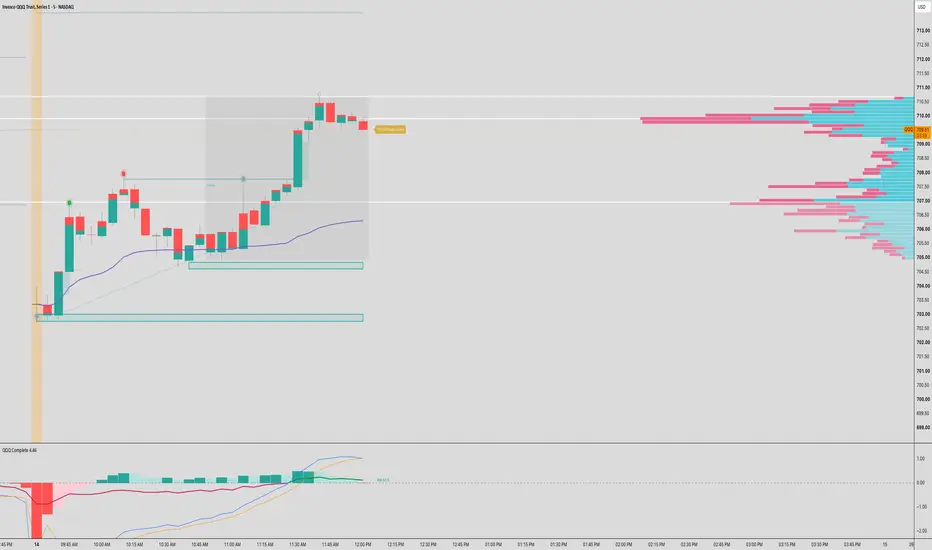
# QQQ Momentum Complete — Trend Structure & Momentum
QQQ Momentum Complete combines automatic trend lines, market structure, Fair Value Gaps and a MACD-style momentum panel. It is designed to help traders read price direction, recognize weakening momentum and compare several timeframes without switching charts.
### Automatic Trend Lines
Trend lines connect two confirmed candle-body pivots. Resistance prioritizes the highest eligible body pivot, while support prioritizes the lowest eligible body pivot and slopes upward.
Small historical price crossings can be tolerated through adjustable settings. Active lines remain fixed until a candle closes beyond the configured break threshold or their anchors expire. Previous lines remain visible as historical context.
### Market Structure
**BOS — Break of Structure** marks a confirmed close beyond a tracked swing level in the established direction. The first qualifying break initializes the direction.
**CHoCH — Change of Character** marks a confirmed break against that direction.
Labels appear below the connecting lines for a cleaner chart.
### Equal Highs and Equal Lows
**EQH** and **EQL** connect consecutive confirmed wick pivots that fall within an adjustable price tolerance.
These are historical formations. Their presence does not mean that the level remains unbroken or that a reversal will follow.
### Support, Resistance and Fair Value Gaps
Support and resistance zones form around confirmed swing extremes.
FVG shading identifies three-candle wick imbalances. The shading stays attached to the formation and contracts as subsequent confirmed candles fill the gap.
### Multi-Timeframe Dashboard
The compact dashboard displays **5m, 15m, 30m and 1h** by default:
- **Structure:** green for bullish structure, red for bearish structure and yellow for mixed structure.
- **Impuls:** green for building upward momentum, red for building downward momentum, yellow for fading momentum and gray for neutral or unavailable data.
- **Reversal:** “Wait” indicates weakening, “Up?” or “Down?” indicates a potential change, and “Up” or “Down” indicates confirmation under the script’s structural rules.
Dashboard values use completed candles from each source timeframe. Tooltips provide additional detail.
### Momentum Panel
The lower panel displays MACD and its signal line, normalized by the previous candle’s ATR. Histogram colors distinguish strengthening and weakening momentum in either direction.
Default MACD settings are **8 / 21 / 5**. The lower panel updates during the live candle, so its developing values may change before the candle closes.
### Additional Features
- Optional EMA 9, 21, 50 and 100 overlays.
- VWAP and previous-session high/low levels.
- Daily opening-candle background highlight, defaulting to **09:30 New York time**.
- Adjustable colors, line widths and dashboard size.
- Optional live candle-body split based on the closing price’s position within the candle’s range.
The candle split is a price-based estimate. It does not measure actual buying/selling volume or opened and closed long/short positions.
### Important Notes
Pivot-based drawings become available only after the required confirmation candles have closed. Although drawings connect earlier pivot candles, they were not known at those earlier moments.
This indicator describes price structure and momentum; it does not predict the next candle or guarantee a reversal. It uses chart data rather than option-chain data, and its default settings are not a validated trading strategy.
QQQ Momentum Complete combines automatic trend lines, market structure, Fair Value Gaps and a MACD-style momentum panel. It is designed to help traders read price direction, recognize weakening momentum and compare several timeframes without switching charts.
### Automatic Trend Lines
Trend lines connect two confirmed candle-body pivots. Resistance prioritizes the highest eligible body pivot, while support prioritizes the lowest eligible body pivot and slopes upward.
Small historical price crossings can be tolerated through adjustable settings. Active lines remain fixed until a candle closes beyond the configured break threshold or their anchors expire. Previous lines remain visible as historical context.
### Market Structure
**BOS — Break of Structure** marks a confirmed close beyond a tracked swing level in the established direction. The first qualifying break initializes the direction.
**CHoCH — Change of Character** marks a confirmed break against that direction.
Labels appear below the connecting lines for a cleaner chart.
### Equal Highs and Equal Lows
**EQH** and **EQL** connect consecutive confirmed wick pivots that fall within an adjustable price tolerance.
These are historical formations. Their presence does not mean that the level remains unbroken or that a reversal will follow.
### Support, Resistance and Fair Value Gaps
Support and resistance zones form around confirmed swing extremes.
FVG shading identifies three-candle wick imbalances. The shading stays attached to the formation and contracts as subsequent confirmed candles fill the gap.
### Multi-Timeframe Dashboard
The compact dashboard displays **5m, 15m, 30m and 1h** by default:
- **Structure:** green for bullish structure, red for bearish structure and yellow for mixed structure.
- **Impuls:** green for building upward momentum, red for building downward momentum, yellow for fading momentum and gray for neutral or unavailable data.
- **Reversal:** “Wait” indicates weakening, “Up?” or “Down?” indicates a potential change, and “Up” or “Down” indicates confirmation under the script’s structural rules.
Dashboard values use completed candles from each source timeframe. Tooltips provide additional detail.
### Momentum Panel
The lower panel displays MACD and its signal line, normalized by the previous candle’s ATR. Histogram colors distinguish strengthening and weakening momentum in either direction.
Default MACD settings are **8 / 21 / 5**. The lower panel updates during the live candle, so its developing values may change before the candle closes.
### Additional Features
- Optional EMA 9, 21, 50 and 100 overlays.
- VWAP and previous-session high/low levels.
- Daily opening-candle background highlight, defaulting to **09:30 New York time**.
- Adjustable colors, line widths and dashboard size.
- Optional live candle-body split based on the closing price’s position within the candle’s range.
The candle split is a price-based estimate. It does not measure actual buying/selling volume or opened and closed long/short positions.
### Important Notes
Pivot-based drawings become available only after the required confirmation candles have closed. Although drawings connect earlier pivot candles, they were not known at those earlier moments.
This indicator describes price structure and momentum; it does not predict the next candle or guarantee a reversal. It uses chart data rather than option-chain data, and its default settings are not a validated trading strategy.
リリースノート
# QQQ Momentum CompleteQQQ Momentum Complete combines market structure, automatic trend lines, Fair Value Gaps, swing-volume markers, and a shared MACD/RSI pane. Developed for intraday chart analysis, it helps visualize price direction, momentum changes, and areas of previous market activity.
### Automatic Trend Lines
Trend lines connect confirmed candle-body pivots. Support lines slope upward, while resistance lines slope downward. Solid segments identify the two anchors, and dashed extensions project the line forward.
Active lines remain fixed until a candle closes beyond the configured break threshold or their anchors expire. Previous lines remain visible within the selected history limit.
### Market Structure and Price Zones
- **BOS:** a close beyond a tracked swing level in the established break direction.
- **CHoCH:** a close beyond a tracked swing level in the opposite direction.
- **EQH / EQL:** approximately equal confirmed swing highs or lows, using adjustable tolerance.
- **Support / Resistance:** zones originating from confirmed wick pivots. Zones are removed after a closing-price violation or expiry.
BOS and CHoCH labels appear below the midpoint of their structure lines.
### Fair Value Gaps
FVGs use a three-candle wick-gap pattern and appear after the third candle closes. Each gap is displayed as a compact, borderless shadow spanning one bar interval.
Subsequent confirmed candle wicks shrink partially filled gaps. Fully filled or expired gaps are removed.
### Swing Volume Bubbles
Circles identify confirmed swing candles with elevated volume relative to a moving average. Larger circles represent higher relative volume.
By default, color reflects the candle’s closing position within its high–low range:
- **Green:** close in the upper portion.
- **Red:** close in the lower portion.
- **Gray:** close near the middle.
These colors estimate price pressure. They do not measure actual buy/sell volume, individual large trades, or order-book liquidity.
### Lower-Timeframe Microstructure
A compact label on the price chart displays local structure from closed analysis candles. The default analysis timeframe is one minute.
States include **Rising, Falling, Reclaim Up, Reclaim Down, Recovery, Decline,** and **Mixed**. Recovery and Decline require a post-reclaim pivot sequence and a continuation close. This module provides independent price-action context; it does not confirm that a particular FVG will hold.
### MACD and RSI
The lower pane combines:
- MACD with default lengths of **6 / 18 / 4**, normalized by the previous candle’s ATR.
- A four-color MACD histogram.
- RSI as a line centered around the shared zero level.
For the displayed RSI line, **0 corresponds to RSI 50**, **+0.4 to RSI 70**, and **−0.4 to RSI 30**. Its color changes above and below RSI 50.
### Additional Features
Optional EMA overlays, daily VWAP, previous-session high/low levels, estimated candle-body pressure coloring, and a configurable opening-candle highlight using New York time.
### Timing and Limitations
Pivot-based drawings become available only after their confirmation bars close. Some drawings are placed on earlier source candles, so their historical position does not represent when they first became known.
Live oscillator values and candle-pressure coloring can change while a candle develops. Lower-timeframe coverage depends on available TradingView data.
The indicator uses chart price and volume data, not options-chain or order-book data. It is an analytical tool, not a prediction system or a guarantee of profitable entries and exits.

免責事項
これらの情報および投稿は、TradingViewが提供または承認する金融、投資、取引、またはその他の種類の助言もしくは推奨であることを意図したものではなく、またこれらに該当するものでもありません。詳細は利用規約をご覧ください。
免責事項
これらの情報および投稿は、TradingViewが提供または承認する金融、投資、取引、またはその他の種類の助言もしくは推奨であることを意図したものではなく、またこれらに該当するものでもありません。詳細は利用規約をご覧ください。