OPEN-SOURCE SCRIPT
更新済 Bollinger Band Lathe
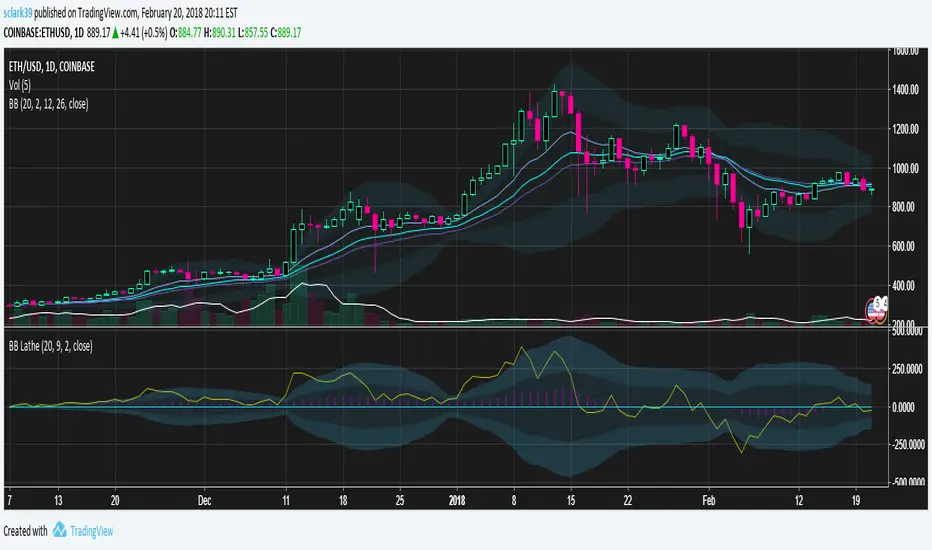
Bollinger Bands shown with a horizontal basis, to make it easier to see how volatility is changing and identify squeeze opportunities.
There is a histogram (purple) which shows how the basis is changing, and a price line (yellow) showing the location of the price within the bollinger bands.
It is tuned to 2 STDEV, but shows the area within 1 STDEV a different color to help visualize when the price is near the extremes of the bands.
By default this uses an exponential moving average to calculate the bollinger basis, but this can be changed in the options.
There is a histogram (purple) which shows how the basis is changing, and a price line (yellow) showing the location of the price within the bollinger bands.
It is tuned to 2 STDEV, but shows the area within 1 STDEV a different color to help visualize when the price is near the extremes of the bands.
By default this uses an exponential moving average to calculate the bollinger basis, but this can be changed in the options.
リリースノート
Made it so the inner bollinger envelope multiple can be modified, and added an optional alternate calculation for stdev which uses the two-pass algorithm which I believe is more accurate than the builtin. Default options are to enable the custom stdev implementation and use EMA for the bollinger basis.リリースノート
Updating to apply a scale factor while calculating the bollinger mean and deviation to increase precision with tiny cryptocurrency exchange rates.オープンソーススクリプト
TradingViewの精神に則り、このスクリプトの作者はコードをオープンソースとして公開してくれました。トレーダーが内容を確認・検証できるようにという配慮です。作者に拍手を送りましょう!無料で利用できますが、コードの再公開はハウスルールに従う必要があります。

免責事項
これらの情報および投稿は、TradingViewが提供または承認する金融、投資、取引、またはその他の種類の助言もしくは推奨であることを意図したものではなく、またこれらに該当するものでもありません。詳細は利用規約をご覧ください。
オープンソーススクリプト
TradingViewの精神に則り、このスクリプトの作者はコードをオープンソースとして公開してくれました。トレーダーが内容を確認・検証できるようにという配慮です。作者に拍手を送りましょう!無料で利用できますが、コードの再公開はハウスルールに従う必要があります。
免責事項
これらの情報および投稿は、TradingViewが提供または承認する金融、投資、取引、またはその他の種類の助言もしくは推奨であることを意図したものではなく、またこれらに該当するものでもありません。詳細は利用規約をご覧ください。