OPEN-SOURCE SCRIPT
更新済 Pi Cycle Top Oscillator
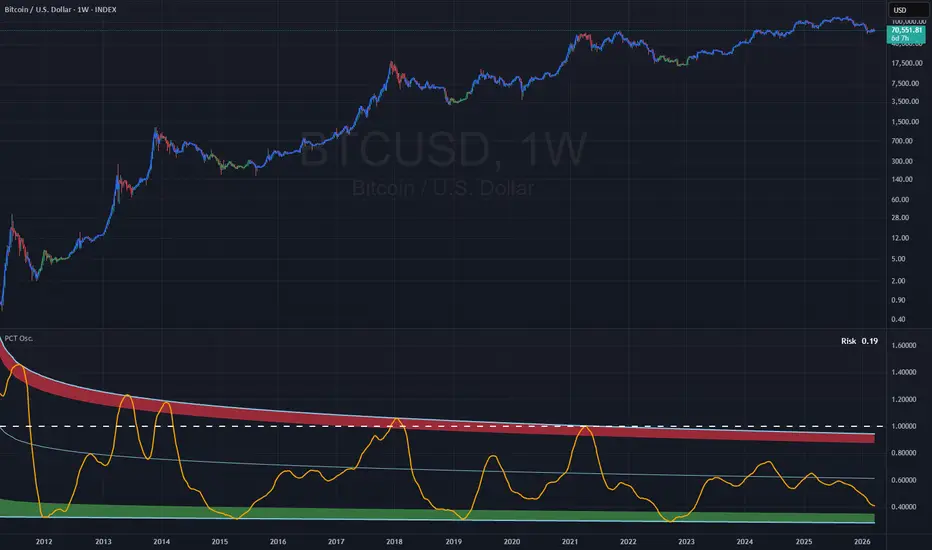
Overview
The Pi Cycle Top Oscillator is an advanced, adaptive iteration of the classic Pi Cycle Top indicator, reimagined as a continuous risk metric. While the original indicator famously predicted Bitcoin’s macro peaks by waiting for a binary crossover of the 111-day SMA and the 2x 350-day SMA, this script translates the relationship between these two moving averages into a normalized 0 to 1 oscillator, providing both buy and sell signals.
As an asset matures, its volatility historically compresses. In the 2021 cycle, the classic moving averages barely touched, meaning future cycles might never see a pure crossover due to the law of diminishing returns. This oscillator solves that problem by replacing the rigid crossover requirement with dynamic, regression-based boundaries.
Tip
Hide the Bitcoin price chart to clearly view the metric in the main chart pane:

How it Works
Instead of waiting for a binary signal, this indicator calculates the exact mathematical ratio between the two moving averages:
Pine Script®
Using historical extremes of this ratio, the script projects two dynamic boundaries:
The current ratio is then normalized between these two converging lines, producing a continuous Risk metric.

Key Features
How to Use
This tool is designed for macro-level portfolio risk management rather than short-term trading.
You can adjust the Buy and Sell zone thresholds in the indicator settings to fit your personal risk tolerance.
Limitations
The Pi Cycle Top Oscillator is an advanced, adaptive iteration of the classic Pi Cycle Top indicator, reimagined as a continuous risk metric. While the original indicator famously predicted Bitcoin’s macro peaks by waiting for a binary crossover of the 111-day SMA and the 2x 350-day SMA, this script translates the relationship between these two moving averages into a normalized 0 to 1 oscillator, providing both buy and sell signals.
As an asset matures, its volatility historically compresses. In the 2021 cycle, the classic moving averages barely touched, meaning future cycles might never see a pure crossover due to the law of diminishing returns. This oscillator solves that problem by replacing the rigid crossover requirement with dynamic, regression-based boundaries.
Tip
Hide the Bitcoin price chart to clearly view the metric in the main chart pane:
How it Works
Instead of waiting for a binary signal, this indicator calculates the exact mathematical ratio between the two moving averages:
Using historical extremes of this ratio, the script projects two dynamic boundaries:
- Top Boundary: A logarithmic regression curve that accounts for historical volatility decay, descending over time.
- Bottom Boundary: A linear regression line representing macro bottoms.
The current ratio is then normalized between these two converging lines, producing a continuous Risk metric.
Key Features
- Continuous Risk Scale: Unlike the classic indicator which is either "on" or "off", this oscillator provides a constant reading from 0 (historical bottom) to 1 (probable macro top).
- Volatility Adjusted: The logarithmic top line factors in macro volatility decay, ensuring the indicator remains relevant in future cycles even if a classic crossover never occurs.
- Visual Chart Feedback: The main chart automatically highlights price bars in Green when Risk falls below your custom Buy Zone Level, and Red when Risk exceeds your Sell Zone Level.
- Dual Display Modes: Use the indicator settings to toggle between the normalized 0-1 "Oscillator" view and the raw "Fit Lines" view to see the actual ratio and regression curves.
How to Use
This tool is designed for macro-level portfolio risk management rather than short-term trading.
- Accumulation: Readings near or below 0.1 historically correlate with macro bottoms, presenting potential long-term accumulation zones.
- Distribution: Readings near or above 0.9 indicate severe market overheating, signaling potential distribution zones.
You can adjust the Buy and Sell zone thresholds in the indicator settings to fit your personal risk tolerance.
Limitations
- Bitcoin Exclusive: This indicator is designed strictly for analyzing Bitcoin. Its mathematical model is based entirely on Bitcoin's historical macro cycles and is not applicable to other cryptocurrencies or traditional assets.
- No Guaranteed Extremes: There are no guarantees that the oscillator will reach the upper or lower boundaries in future cycles, nor that it will remain strictly within the 0 to 1 range. For example, during the 2025 cycle, the oscillator never reached the theoretical sell zone, demonstrating that market dynamics can and do shift.
- Static Curve Fitting: The regression curves for the upper and lower boundaries were fitted using the global tops and bottoms of the 111-day and 2x 350-day SMA ratio prior to 2023. The resulting equation coefficients are hardcoded directly into the script. As new macro extremes form in the future, these boundary models may eventually require a new approximation to maintain their accuracy.
リリースノート
Changes:/b]- Fixed a bug with the buy and sell zones display on the main chart.
- Added a toggle to turn the colored price line overlay on your main chart on or off.
オープンソーススクリプト
TradingViewの精神に則り、このスクリプトの作者はコードをオープンソースとして公開してくれました。トレーダーが内容を確認・検証できるようにという配慮です。作者に拍手を送りましょう!無料で利用できますが、コードの再公開はハウスルールに従う必要があります。

免責事項
これらの情報および投稿は、TradingViewが提供または承認する金融、投資、取引、またはその他の種類の助言もしくは推奨であることを意図したものではなく、またこれらに該当するものでもありません。詳細は利用規約をご覧ください。
オープンソーススクリプト
TradingViewの精神に則り、このスクリプトの作者はコードをオープンソースとして公開してくれました。トレーダーが内容を確認・検証できるようにという配慮です。作者に拍手を送りましょう!無料で利用できますが、コードの再公開はハウスルールに従う必要があります。
免責事項
これらの情報および投稿は、TradingViewが提供または承認する金融、投資、取引、またはその他の種類の助言もしくは推奨であることを意図したものではなく、またこれらに該当するものでもありません。詳細は利用規約をご覧ください。