OPEN-SOURCE SCRIPT
更新済 Time Intervals (Bars)
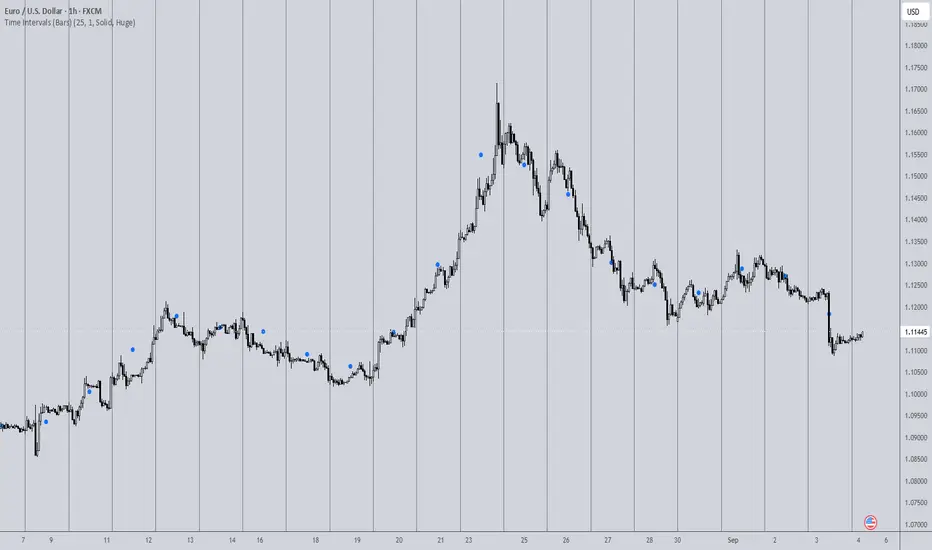
Bar Cycle Vertical Lines
This indicator provides a simple but powerful way to segment price action into consistent, repeatable intervals based on a user-defined number of bars. Each vertical line marks the start of a new cycle, allowing traders to visually break the chart into uniform “market rhythm blocks.”
Unlike time-based segmentation, this approach is fully bar-driven, meaning each cycle represents an equal amount of market interaction regardless of time or session conditions.
How It Works
• The user selects a fixed number of bars per cycle
• A vertical line is drawn every N bars
• These lines divide price action into equal structural segments
This creates a clean visual framework for analyzing repeating behavior in price.
How It Can Be Used
This tool is especially useful for evaluating market frequency in a practical, visual way:
• Identify how often structure shifts occur within fixed interaction intervals
• Compare expansion and compression behavior across equal bar cycles
• Study how trends evolve relative to consistent “market beats”
• Align other tools (such as oscillators or wave models) to cycle boundaries
• Evaluate whether price is accelerating or decelerating across repeating segments
By observing how price behaves between each cycle line, traders can begin to recognize repeating structural rhythm — or the absence of it.
Key Concept: Frequency Visualization
While the indicator is extremely simple, it becomes powerful when viewed through the lens of frequency:
• Tight clustering of movement between lines = high-frequency / choppy environment
• Strong directional movement across multiple cycles = low-frequency trending behavior
• Irregular behavior between cycles = unstable or transitional regimes
This makes it a lightweight but effective way to visually assess how “fast” or “slow” the market is behaving in structural terms.
Why It’s Useful
The strength of this indicator lies in its simplicity:
• No complex calculations
• No lagging signals
• No assumptions about price direction
Just clean, repeatable segmentation of market activity.
Despite its simplicity, it becomes a powerful analytical foundation when combined with other tools such as cycle waves, efficiency models, or structure-based systems.
Summary
This indicator turns price into a series of equal behavioral intervals, allowing traders to study frequency, rhythm, and structural consistency in a clean and intuitive way. It is intentionally minimal — designed not to predict, but to reveal how the market behaves over repeated cycles.
This indicator provides a simple but powerful way to segment price action into consistent, repeatable intervals based on a user-defined number of bars. Each vertical line marks the start of a new cycle, allowing traders to visually break the chart into uniform “market rhythm blocks.”
Unlike time-based segmentation, this approach is fully bar-driven, meaning each cycle represents an equal amount of market interaction regardless of time or session conditions.
How It Works
• The user selects a fixed number of bars per cycle
• A vertical line is drawn every N bars
• These lines divide price action into equal structural segments
This creates a clean visual framework for analyzing repeating behavior in price.
How It Can Be Used
This tool is especially useful for evaluating market frequency in a practical, visual way:
• Identify how often structure shifts occur within fixed interaction intervals
• Compare expansion and compression behavior across equal bar cycles
• Study how trends evolve relative to consistent “market beats”
• Align other tools (such as oscillators or wave models) to cycle boundaries
• Evaluate whether price is accelerating or decelerating across repeating segments
By observing how price behaves between each cycle line, traders can begin to recognize repeating structural rhythm — or the absence of it.
Key Concept: Frequency Visualization
While the indicator is extremely simple, it becomes powerful when viewed through the lens of frequency:
• Tight clustering of movement between lines = high-frequency / choppy environment
• Strong directional movement across multiple cycles = low-frequency trending behavior
• Irregular behavior between cycles = unstable or transitional regimes
This makes it a lightweight but effective way to visually assess how “fast” or “slow” the market is behaving in structural terms.
Why It’s Useful
The strength of this indicator lies in its simplicity:
• No complex calculations
• No lagging signals
• No assumptions about price direction
Just clean, repeatable segmentation of market activity.
Despite its simplicity, it becomes a powerful analytical foundation when combined with other tools such as cycle waves, efficiency models, or structure-based systems.
Summary
This indicator turns price into a series of equal behavioral intervals, allowing traders to study frequency, rhythm, and structural consistency in a clean and intuitive way. It is intentionally minimal — designed not to predict, but to reveal how the market behaves over repeated cycles.
リリースノート
• Center markers addedオープンソーススクリプト
TradingViewの精神に則り、このスクリプトの作者はコードをオープンソースとして公開してくれました。トレーダーが内容を確認・検証できるようにという配慮です。作者に拍手を送りましょう!無料で利用できますが、コードの再公開はハウスルールに従う必要があります。

免責事項
これらの情報および投稿は、TradingViewが提供または承認する金融、投資、取引、またはその他の種類の助言もしくは推奨であることを意図したものではなく、またこれらに該当するものでもありません。詳細は利用規約をご覧ください。
オープンソーススクリプト
TradingViewの精神に則り、このスクリプトの作者はコードをオープンソースとして公開してくれました。トレーダーが内容を確認・検証できるようにという配慮です。作者に拍手を送りましょう!無料で利用できますが、コードの再公開はハウスルールに従う必要があります。
免責事項
これらの情報および投稿は、TradingViewが提供または承認する金融、投資、取引、またはその他の種類の助言もしくは推奨であることを意図したものではなく、またこれらに該当するものでもありません。詳細は利用規約をご覧ください。