OPEN-SOURCE SCRIPT
TraxisLab - Core Map
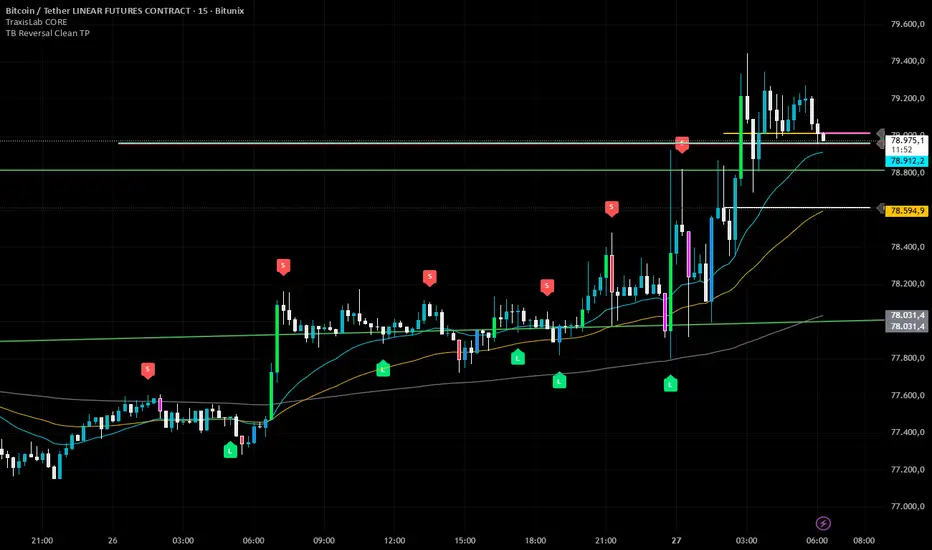
TraxisLab Core Map is a clean market-structure and analysis layer designed to give traders a clear overview of price, volume, trend, and key reference levels without entry signals, sweep clutter, or unnecessary noise.
This indicator combines Vector Candles, anchored VWAP levels, Daily Open, EMAs, and a Rolling POC / Value Area model into one lightweight visual framework.
The goal of Core Map is simple:
to help traders read where price is trading relative to important volume, session, and trend references.
Key Features
Vector Candles
Highlights candles with unusually strong volume-spread force compared to the recent average.
Extreme vectors are separated from regular vectors to make high-effort candles easier to identify.
Custom Candle Coloring
Bullish, bearish, normal, vector, and extreme candles can all be customized individually.
Multi-Timeframe VWAP Anchors
Displays VWAP levels anchored to:
Daily
Weekly
Monthly
4H
Each VWAP is drawn as a clean horizontal reference line with optional labels and projection.
Daily Open
Shows the current daily open as a key intraday reference level.
EMAs
Includes three customizable exponential moving averages:
Fast EMA
Mid EMA
Slow EMA
Useful for trend context and dynamic support/resistance.
Rolling POC
Calculates a rolling Point of Control based on recent volume distribution across price bins.
Value Area High / Value Area Low
Optional VAH and VAL levels help visualize the current rolling value area around the POC.
Small Info Table
A compact table displays current vector status, POC, daily VWAP, and daily open.
How to Use
Use this indicator as a market map, not as a standalone signal system.
Core Map is designed to help answer questions like:
Is price above or below the Daily Open?
Is price reacting around Daily, Weekly, or 4H VWAP?
Where is the current rolling POC?
Is price trading inside or outside the value area?
Are strong vector candles appearing at important reference levels?
Are EMAs aligned with the current market direction?
The strongest use case is combining the visual levels with your own trading model, session context, and confirmation tools.
Notes
This script does not generate buy or sell signals.
It is intended as a clean analytical overlay for discretionary traders.
The Rolling POC is an approximation based on selected lookback bars and price bins. It is designed for visual context and may differ from exchange-native volume profile tools.
Disclaimer
This indicator is for educational and analytical purposes only.
It does not provide financial advice, trading recommendations, or guaranteed results. Always use proper risk management and perform your own analysis before making trading decisions.
This indicator combines Vector Candles, anchored VWAP levels, Daily Open, EMAs, and a Rolling POC / Value Area model into one lightweight visual framework.
The goal of Core Map is simple:
to help traders read where price is trading relative to important volume, session, and trend references.
Key Features
Vector Candles
Highlights candles with unusually strong volume-spread force compared to the recent average.
Extreme vectors are separated from regular vectors to make high-effort candles easier to identify.
Custom Candle Coloring
Bullish, bearish, normal, vector, and extreme candles can all be customized individually.
Multi-Timeframe VWAP Anchors
Displays VWAP levels anchored to:
Daily
Weekly
Monthly
4H
Each VWAP is drawn as a clean horizontal reference line with optional labels and projection.
Daily Open
Shows the current daily open as a key intraday reference level.
EMAs
Includes three customizable exponential moving averages:
Fast EMA
Mid EMA
Slow EMA
Useful for trend context and dynamic support/resistance.
Rolling POC
Calculates a rolling Point of Control based on recent volume distribution across price bins.
Value Area High / Value Area Low
Optional VAH and VAL levels help visualize the current rolling value area around the POC.
Small Info Table
A compact table displays current vector status, POC, daily VWAP, and daily open.
How to Use
Use this indicator as a market map, not as a standalone signal system.
Core Map is designed to help answer questions like:
Is price above or below the Daily Open?
Is price reacting around Daily, Weekly, or 4H VWAP?
Where is the current rolling POC?
Is price trading inside or outside the value area?
Are strong vector candles appearing at important reference levels?
Are EMAs aligned with the current market direction?
The strongest use case is combining the visual levels with your own trading model, session context, and confirmation tools.
Notes
This script does not generate buy or sell signals.
It is intended as a clean analytical overlay for discretionary traders.
The Rolling POC is an approximation based on selected lookback bars and price bins. It is designed for visual context and may differ from exchange-native volume profile tools.
Disclaimer
This indicator is for educational and analytical purposes only.
It does not provide financial advice, trading recommendations, or guaranteed results. Always use proper risk management and perform your own analysis before making trading decisions.
オープンソーススクリプト
TradingViewの精神に則り、このスクリプトの作者はコードをオープンソースとして公開してくれました。トレーダーが内容を確認・検証できるようにという配慮です。作者に拍手を送りましょう!無料で利用できますが、コードの再公開はハウスルールに従う必要があります。

免責事項
これらの情報および投稿は、TradingViewが提供または承認する金融、投資、取引、またはその他の種類の助言もしくは推奨であることを意図したものではなく、またこれらに該当するものでもありません。詳細は利用規約をご覧ください。
オープンソーススクリプト
TradingViewの精神に則り、このスクリプトの作者はコードをオープンソースとして公開してくれました。トレーダーが内容を確認・検証できるようにという配慮です。作者に拍手を送りましょう!無料で利用できますが、コードの再公開はハウスルールに従う必要があります。
免責事項
これらの情報および投稿は、TradingViewが提供または承認する金融、投資、取引、またはその他の種類の助言もしくは推奨であることを意図したものではなく、またこれらに該当するものでもありません。詳細は利用規約をご覧ください。