OPEN-SOURCE SCRIPT
GFG Candle Countdown HH:MM:SS by Agaam
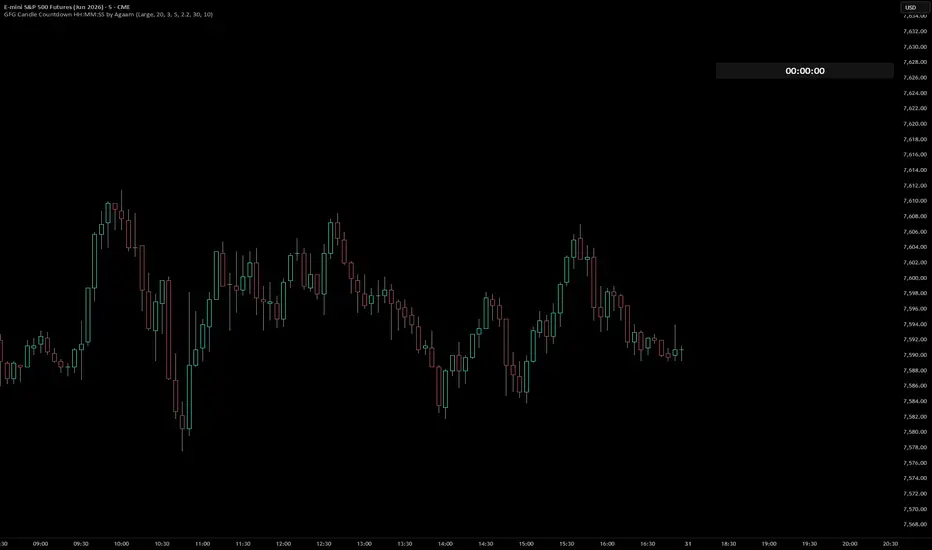
## GFG Candle Countdown HH:MM:SS
**GFG Candle Countdown HH:MM:SS** is a clean chart utility that displays the remaining time before the current candle closes in **hours:minutes:seconds** format.
The purpose of this script is to help traders clearly see how much time is left in the active candle without adding signals, arrows, chart labels, or extra visual clutter. The countdown is displayed in a simple table on the top-right side of the chart and can be moved lower using the vertical offset settings.
## What This Indicator Does
This indicator calculates the remaining time until the current candle closes by comparing the candle’s close time with the current real-time clock. The result is displayed in this format:
**HH:MM:SS**
For example:
**01:24:35**
means there is 1 hour, 24 minutes, and 35 seconds left before the current candle closes.
This version is useful not only for short intraday charts, but also for higher timeframes where candles may have more than one hour remaining.
## Why This Script Is Useful
Many traders prefer to wait for candle close confirmation before making a decision. This script helps make candle timing easier to see directly on the chart.
It can be useful for:
* Waiting for candle close confirmation
* Monitoring higher-timeframe candle closes
* Avoiding early entries before a candle is finished
* Managing trades around candle close
* Watching active bars without cluttering the chart
* Keeping timing visible while focusing on price action
## Clean Chart Design
This indicator is intentionally simple. It does not generate buy signals, sell signals, trend signals, alerts, arrows, or candle labels.
It only displays the candle countdown timer.
The visual layout is designed to stay clean:
* Right-side table display
* Only HH:MM:SS numbers
* No extra words on the chart
* Adjustable size
* Adjustable cell width and height
* Adjustable vertical position
* Custom background color
* Custom number color
This keeps the chart clean while still giving the trader important timing information.
## Warning Color Option
The script includes optional warning colors for traders who want the countdown to visually change as the candle gets closer to closing.
Users can customize:
* Warning color
* Danger color
* Warning seconds threshold
* Danger seconds threshold
For example, the countdown can turn yellow when fewer than 30 seconds remain and red when fewer than 10 seconds remain.
This feature is optional and can be turned off for a simple one-color timer.
## Customization
Users can adjust:
* Show or hide the countdown
* Countdown text size
* Countdown cell width
* Countdown cell height
* Vertical offset rows
* Offset row height
* Background color
* Countdown number color
* Warning color
* Danger color
* Warning and danger timing levels
These settings allow the timer to be positioned and styled to fit different chart layouts.
## How Traders Can Use It
A simple way to use this indicator:
1. Add it to the chart.
2. Place the countdown where it is easy to see.
3. Watch the remaining candle time before making candle-close-based decisions.
4. Use it as a timing tool together with your own trading plan.
This script does not predict price direction. It is only designed to show candle time remaining.
## Important Notes
The countdown works on time-based charts where candle close time is available. On chart types where candle close time is not available, the script may display **N/A**.
The countdown is based on the chart’s active candle close time and updates on the latest bar.
## Disclaimer
This indicator is for educational and informational purposes only. It is not financial advice, investment advice, or a guaranteed trading system. Trading involves risk, and every trader is responsible for their own decisions.
**GFG Candle Countdown HH:MM:SS** is a clean chart utility that displays the remaining time before the current candle closes in **hours:minutes:seconds** format.
The purpose of this script is to help traders clearly see how much time is left in the active candle without adding signals, arrows, chart labels, or extra visual clutter. The countdown is displayed in a simple table on the top-right side of the chart and can be moved lower using the vertical offset settings.
## What This Indicator Does
This indicator calculates the remaining time until the current candle closes by comparing the candle’s close time with the current real-time clock. The result is displayed in this format:
**HH:MM:SS**
For example:
**01:24:35**
means there is 1 hour, 24 minutes, and 35 seconds left before the current candle closes.
This version is useful not only for short intraday charts, but also for higher timeframes where candles may have more than one hour remaining.
## Why This Script Is Useful
Many traders prefer to wait for candle close confirmation before making a decision. This script helps make candle timing easier to see directly on the chart.
It can be useful for:
* Waiting for candle close confirmation
* Monitoring higher-timeframe candle closes
* Avoiding early entries before a candle is finished
* Managing trades around candle close
* Watching active bars without cluttering the chart
* Keeping timing visible while focusing on price action
## Clean Chart Design
This indicator is intentionally simple. It does not generate buy signals, sell signals, trend signals, alerts, arrows, or candle labels.
It only displays the candle countdown timer.
The visual layout is designed to stay clean:
* Right-side table display
* Only HH:MM:SS numbers
* No extra words on the chart
* Adjustable size
* Adjustable cell width and height
* Adjustable vertical position
* Custom background color
* Custom number color
This keeps the chart clean while still giving the trader important timing information.
## Warning Color Option
The script includes optional warning colors for traders who want the countdown to visually change as the candle gets closer to closing.
Users can customize:
* Warning color
* Danger color
* Warning seconds threshold
* Danger seconds threshold
For example, the countdown can turn yellow when fewer than 30 seconds remain and red when fewer than 10 seconds remain.
This feature is optional and can be turned off for a simple one-color timer.
## Customization
Users can adjust:
* Show or hide the countdown
* Countdown text size
* Countdown cell width
* Countdown cell height
* Vertical offset rows
* Offset row height
* Background color
* Countdown number color
* Warning color
* Danger color
* Warning and danger timing levels
These settings allow the timer to be positioned and styled to fit different chart layouts.
## How Traders Can Use It
A simple way to use this indicator:
1. Add it to the chart.
2. Place the countdown where it is easy to see.
3. Watch the remaining candle time before making candle-close-based decisions.
4. Use it as a timing tool together with your own trading plan.
This script does not predict price direction. It is only designed to show candle time remaining.
## Important Notes
The countdown works on time-based charts where candle close time is available. On chart types where candle close time is not available, the script may display **N/A**.
The countdown is based on the chart’s active candle close time and updates on the latest bar.
## Disclaimer
This indicator is for educational and informational purposes only. It is not financial advice, investment advice, or a guaranteed trading system. Trading involves risk, and every trader is responsible for their own decisions.
オープンソーススクリプト
TradingViewの精神に則り、このスクリプトの作者はコードをオープンソースとして公開してくれました。トレーダーが内容を確認・検証できるようにという配慮です。作者に拍手を送りましょう!無料で利用できますが、コードの再公開はハウスルールに従う必要があります。

免責事項
これらの情報および投稿は、TradingViewが提供または承認する金融、投資、取引、またはその他の種類の助言もしくは推奨であることを意図したものではなく、またこれらに該当するものでもありません。詳細は利用規約をご覧ください。
オープンソーススクリプト
TradingViewの精神に則り、このスクリプトの作者はコードをオープンソースとして公開してくれました。トレーダーが内容を確認・検証できるようにという配慮です。作者に拍手を送りましょう!無料で利用できますが、コードの再公開はハウスルールに従う必要があります。
免責事項
これらの情報および投稿は、TradingViewが提供または承認する金融、投資、取引、またはその他の種類の助言もしくは推奨であることを意図したものではなく、またこれらに該当するものでもありません。詳細は利用規約をご覧ください。