OPEN-SOURCE SCRIPT
更新済 BTC Aggregated Funding Rate
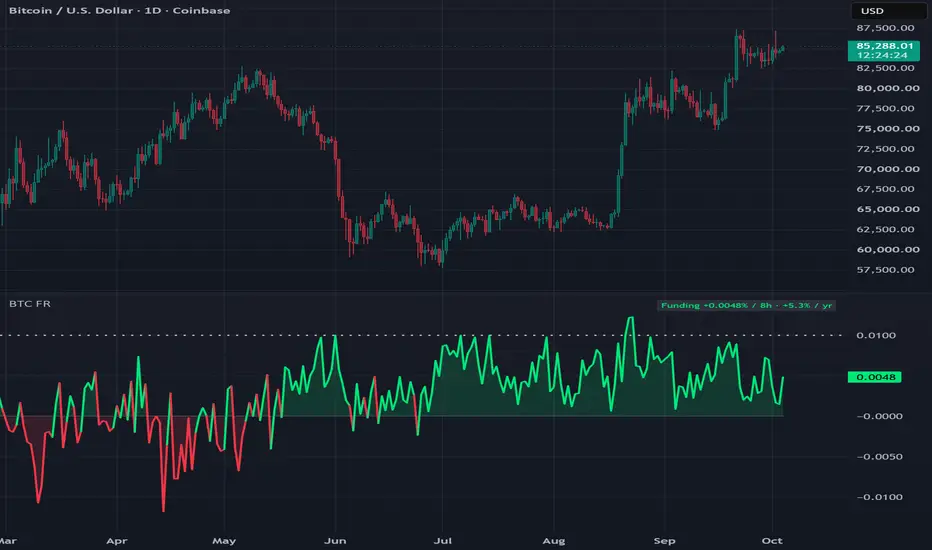
BTC Aggregated Funding Rate
Funding across Binance, Bybit, OKX and Hyperliquid, put on a common basis and combined into one line — so you see what the whole perpetual market is paying, not one exchange.
WHAT IT SHOWS
- Funding line: green when positive (longs pay shorts), red when negative (shorts pay longs), shaded to zero.
- Neutral baseline (dotted): 0.01% per 8 hours (about 10.95% a year), the standard rate most exchanges settle at when neither side is crowded.
- Summary (top right): current funding per 8 hours and annualized.
WHAT MAKES IT DIFFERENT
- Common basis across exchanges. Hyperliquid pays funding every hour while the others pay every 8 hours. Averaging those raw rates together understates funding roughly eightfold; here every exchange is converted to a per-8-hour rate first.
- OI-weighted. Each exchange's funding is weighted by its open interest, so larger markets count for more. A simple average is available as an option.
- Unit detection. Funding data can arrive as a fraction (0.0001) or a percent (0.01); the script detects which and converts automatically, with a manual override.
HOW TO READ IT
- Near the baseline: balanced positioning.
- Well above the baseline: longs paying up to hold positions — leverage is leaning long.
- Below zero: shorts paying — leverage is leaning short.
- Funding describes how positioning leans, not when it will unwind. Crowded readings can persist for weeks in a strong trend. Read it alongside open interest and price structure rather than as a signal on its own.
SETTINGS
- Exchanges: toggle each one, change the symbol, set its OI unit (used for weighting) and its funding interval in hours.
- Show funding per 8 hours or annualized.
- OI-weighted or simple average.
- Optional smoothing, shading and baseline.
NOTES
- Funding data is retrieved with TradingView's open-source Request library (cryptoDerivativeMetric); open interest for weighting uses TradingView's "_OI" feeds.
- Values are taken at each bar's close; on the daily chart each point is that day's closing funding reading.
- Exchange histories start at different dates; early values may include fewer exchanges.
- This is an analysis tool, not financial advice or a trading signal.
Funding across Binance, Bybit, OKX and Hyperliquid, put on a common basis and combined into one line — so you see what the whole perpetual market is paying, not one exchange.
WHAT IT SHOWS
- Funding line: green when positive (longs pay shorts), red when negative (shorts pay longs), shaded to zero.
- Neutral baseline (dotted): 0.01% per 8 hours (about 10.95% a year), the standard rate most exchanges settle at when neither side is crowded.
- Summary (top right): current funding per 8 hours and annualized.
WHAT MAKES IT DIFFERENT
- Common basis across exchanges. Hyperliquid pays funding every hour while the others pay every 8 hours. Averaging those raw rates together understates funding roughly eightfold; here every exchange is converted to a per-8-hour rate first.
- OI-weighted. Each exchange's funding is weighted by its open interest, so larger markets count for more. A simple average is available as an option.
- Unit detection. Funding data can arrive as a fraction (0.0001) or a percent (0.01); the script detects which and converts automatically, with a manual override.
HOW TO READ IT
- Near the baseline: balanced positioning.
- Well above the baseline: longs paying up to hold positions — leverage is leaning long.
- Below zero: shorts paying — leverage is leaning short.
- Funding describes how positioning leans, not when it will unwind. Crowded readings can persist for weeks in a strong trend. Read it alongside open interest and price structure rather than as a signal on its own.
SETTINGS
- Exchanges: toggle each one, change the symbol, set its OI unit (used for weighting) and its funding interval in hours.
- Show funding per 8 hours or annualized.
- OI-weighted or simple average.
- Optional smoothing, shading and baseline.
NOTES
- Funding data is retrieved with TradingView's open-source Request library (cryptoDerivativeMetric); open interest for weighting uses TradingView's "_OI" feeds.
- Values are taken at each bar's close; on the daily chart each point is that day's closing funding reading.
- Exchange histories start at different dates; early values may include fewer exchanges.
- This is an analysis tool, not financial advice or a trading signal.
リリースノート
Fixed a minor graphical detailリリースノート
Minor background changeリリースノート
Minor: the neutral baseline (0.01% per 8h) is now a clearly dotted line, with style (dotted / dashed), color and width settings.オープンソーススクリプト
TradingViewの精神に則り、このスクリプトの作者はコードをオープンソースとして公開してくれました。トレーダーが内容を確認・検証できるようにという配慮です。作者に拍手を送りましょう!無料で利用できますが、コードの再公開はハウスルールに従う必要があります。

免責事項
これらの情報および投稿は、TradingViewが提供または承認する金融、投資、取引、またはその他の種類の助言もしくは推奨であることを意図したものではなく、またこれらに該当するものでもありません。詳細は利用規約をご覧ください。
オープンソーススクリプト
TradingViewの精神に則り、このスクリプトの作者はコードをオープンソースとして公開してくれました。トレーダーが内容を確認・検証できるようにという配慮です。作者に拍手を送りましょう!無料で利用できますが、コードの再公開はハウスルールに従う必要があります。
免責事項
これらの情報および投稿は、TradingViewが提供または承認する金融、投資、取引、またはその他の種類の助言もしくは推奨であることを意図したものではなく、またこれらに該当するものでもありません。詳細は利用規約をご覧ください。