OPEN-SOURCE SCRIPT
更新済 EAB: Multi-Timeframe Moving Averages
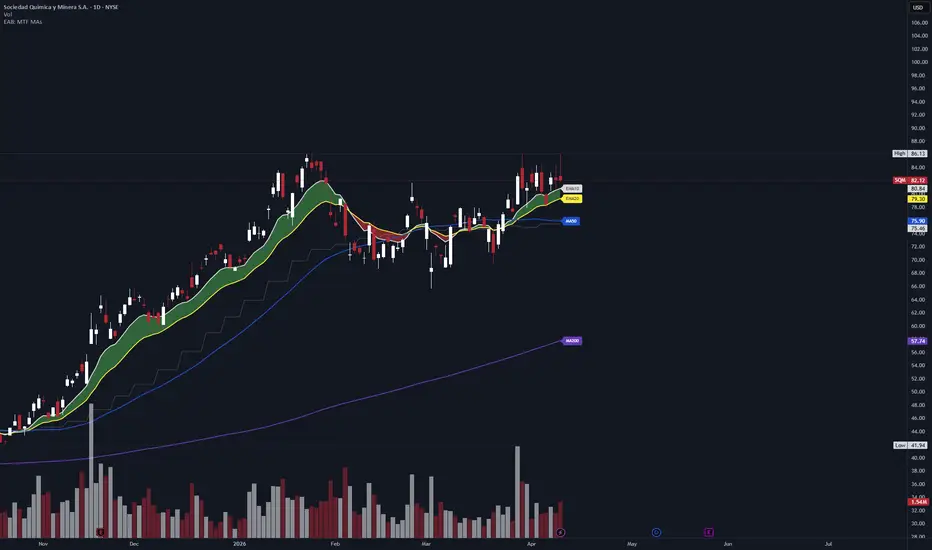
EAB: Multi-Timeframe Moving Averages is a clean and customizable indicator designed to display key moving averages across multiple timeframes in a single chart.
It allows traders to visualize short, medium, and long-term trends using a consistent and structured framework, aligned with a professional trading workflow.
Features
Multi-timeframe support: Intraday, Daily, Weekly and Monthly
Fully customizable moving averages (type, length, source, color and visibility)
Label system displayed directly on the chart (e.g., EMA 10, MA 50)
Optional moving average cloud between key averages
Weekly moving average overlay on the daily chart for higher timeframe context
How to use
Enable or disable moving averages from each timeframe section.
Configure type (EMA, SMA, etc.) and length according to your strategy.
Use EMA 10 and EMA 20 for short-term trend direction.
Use MA 50 and MA 200 for structure and key support/resistance levels.
Combine multiple timeframes to confirm trend alignment.
Notes
Labels are displayed only on the last visible bar to keep the chart clean.
Each timeframe can be configured independently.
Moving average clouds can be enabled or disabled for better visual clarity.
It allows traders to visualize short, medium, and long-term trends using a consistent and structured framework, aligned with a professional trading workflow.
Features
Multi-timeframe support: Intraday, Daily, Weekly and Monthly
Fully customizable moving averages (type, length, source, color and visibility)
Label system displayed directly on the chart (e.g., EMA 10, MA 50)
Optional moving average cloud between key averages
Weekly moving average overlay on the daily chart for higher timeframe context
How to use
Enable or disable moving averages from each timeframe section.
Configure type (EMA, SMA, etc.) and length according to your strategy.
Use EMA 10 and EMA 20 for short-term trend direction.
Use MA 50 and MA 200 for structure and key support/resistance levels.
Combine multiple timeframes to confirm trend alignment.
Notes
Labels are displayed only on the last visible bar to keep the chart clean.
Each timeframe can be configured independently.
Moving average clouds can be enabled or disabled for better visual clarity.
リリースノート
Version 1.1.0• Added label background transparency control
• Added horizontal tag offset adjustment
• Added vertical label spacing adjustment
• Improved tag readability when moving averages cluster
リリースノート
Version 1.1.1• Minor changes
オープンソーススクリプト
TradingViewの精神に則り、このスクリプトの作者はコードをオープンソースとして公開してくれました。トレーダーが内容を確認・検証できるようにという配慮です。作者に拍手を送りましょう!無料で利用できますが、コードの再公開はハウスルールに従う必要があります。

免責事項
これらの情報および投稿は、TradingViewが提供または承認する金融、投資、取引、またはその他の種類の助言もしくは推奨であることを意図したものではなく、またこれらに該当するものでもありません。詳細は利用規約をご覧ください。
オープンソーススクリプト
TradingViewの精神に則り、このスクリプトの作者はコードをオープンソースとして公開してくれました。トレーダーが内容を確認・検証できるようにという配慮です。作者に拍手を送りましょう!無料で利用できますが、コードの再公開はハウスルールに従う必要があります。
免責事項
これらの情報および投稿は、TradingViewが提供または承認する金融、投資、取引、またはその他の種類の助言もしくは推奨であることを意図したものではなく、またこれらに該当するものでもありません。詳細は利用規約をご覧ください。