OPEN-SOURCE SCRIPT
BTC Halving Indicator
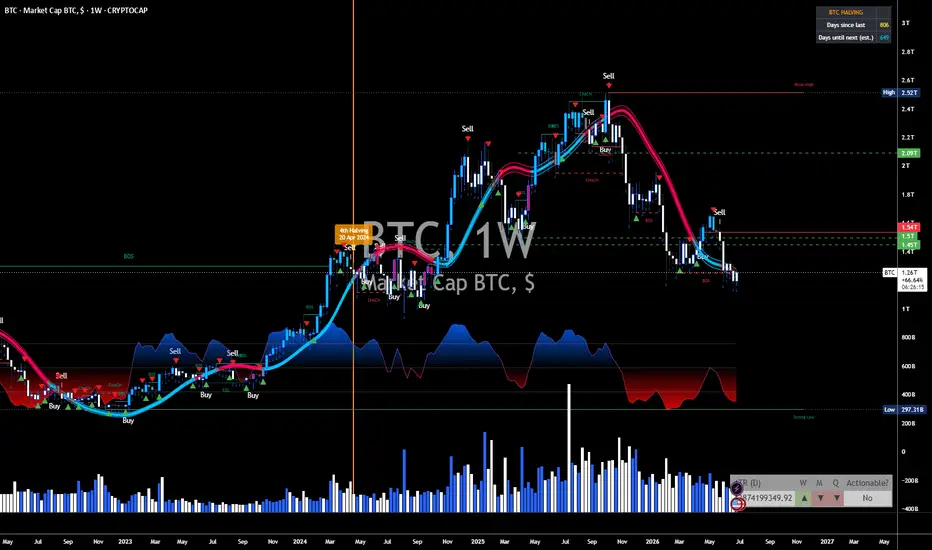
**What it does:**
- Draws an **orange vertical line + label** at each past halving: 28 Nov 2012, 9 Jul 2016, 11 May 2020, and 20 Apr 2024
- Draws a **dashed aqua line** at the estimated 5th halving (~April 2028) when it's close enough to appear on your chart
- Shows a **live counter table** in the top-right: days since the last halving and estimated days until the next one
- Has settings to change colors and toggle the labels/counter on or off
**How to install it in TradingView:**
1. Open a BTC chart (e.g. BTCUSD) on tradingview.com
2. Click **Pine Editor** at the bottom of the screen
3. Delete whatever's in the editor, paste in the full contents of the file
4. Click **Save**, then **Add to chart**
Two tips: use the **daily or weekly timeframe** — on low timeframes like 5m, TradingView doesn't load history back to 2012, so the older halving lines won't appear. And note the 2028 date is an estimate; the actual halving happens at block 1,050,000, so the real date drifts slightly with block times.
Want me to add anything, like cycle-phase background shading or price-at-halving markers?
オープンソーススクリプト
TradingViewの精神に則り、このスクリプトの作者はコードをオープンソースとして公開してくれました。トレーダーが内容を確認・検証できるようにという配慮です。作者に拍手を送りましょう!無料で利用できますが、コードの再公開はハウスルールに従う必要があります。

免責事項
これらの情報および投稿は、TradingViewが提供または承認する金融、投資、取引、またはその他の種類の助言もしくは推奨であることを意図したものではなく、またこれらに該当するものでもありません。詳細は利用規約をご覧ください。
オープンソーススクリプト
TradingViewの精神に則り、このスクリプトの作者はコードをオープンソースとして公開してくれました。トレーダーが内容を確認・検証できるようにという配慮です。作者に拍手を送りましょう!無料で利用できますが、コードの再公開はハウスルールに従う必要があります。
免責事項
これらの情報および投稿は、TradingViewが提供または承認する金融、投資、取引、またはその他の種類の助言もしくは推奨であることを意図したものではなく、またこれらに該当するものでもありません。詳細は利用規約をご覧ください。