OPEN-SOURCE SCRIPT
Wyckoff Accumulation Identification
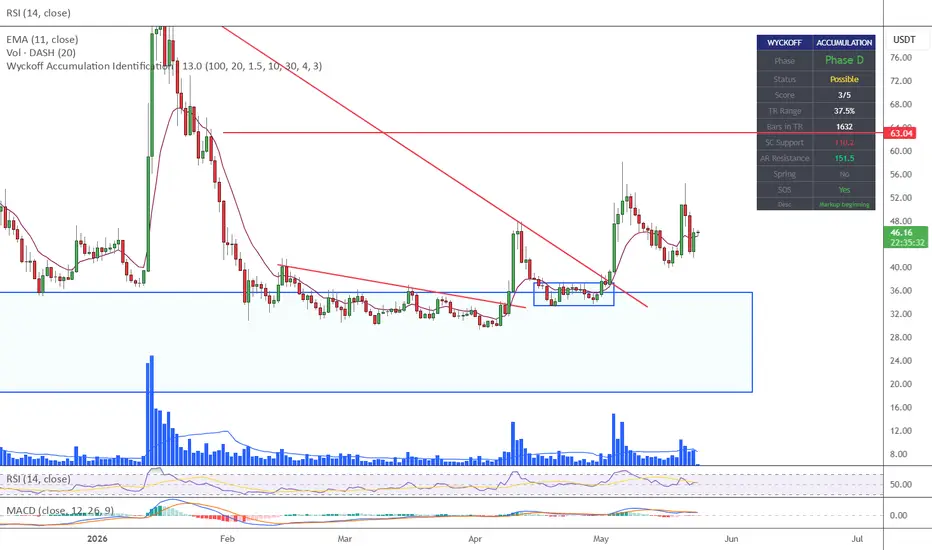
Wyckoff Accumulation Identification
- 1. wyckoffdistribution1.png` — Distribution Schematic #1 (with UTAD)
- 2. wyckoffdistribution2.png` — Distribution Schematic #2 (without UTAD)
- 3. wyckoffaccumulation1.png` — Accumulation Schematic #1 (with Spring)
- 4. wyckoffaccumulation2.png` — Accumulation Schematic #2 (without Spring)
### Event Mapping — Accumulation
| Event | Chart Signal | Volume |
|---|---|---|
| PS (Preliminary Support) | First volume spike in downtrend, price pauses temporarily | Spike |
| SC (Selling Climax) | Large red candle + long lower wick, lowest low | Extremely high |
| AR (Automatic Rally) | Sharp bounce from SC, defines top of TR | Moderate |
| ST (Secondary Test) | Retest SC zone, higher low than SC | Lower than SC |
| Spring | False break below SC then closes back inside TR | Low or high |
| Test of Spring | Retest Spring low, fails to break it | Very low |
| SOS (Sign of Strength) | Strong rally through top of TR | Surge |
| LPS (Last Point of Support) | Pullback to former TR top (now support) | Low |
### Event Mapping — Distribution
| Event | Chart Signal | Volume |
|---|---|---|
| PSY (Preliminary Supply) | Price slows, volume spike in uptrend | Spike |
| BC (Buying Climax) | Large green candle + long upper wick, highest high | Extremely high |
| AR (Automatic Reaction) | Sharp drop from BC, defines bottom of TR | Moderate |
| ST (Secondary Test) | Retest BC zone, lower high than BC | Lower than BC |
| UTAD (Upthrust After Distribution) | False break above BC then closes back inside TR | Low or high |
| LPSY (Last Point of Supply) | Weak rally fails to reach top of TR | Low |
| SOW (Sign of Weakness) | Break below bottom of TR, volume surges | Surge |
オープンソーススクリプト
TradingViewの精神に則り、このスクリプトの作者はコードをオープンソースとして公開してくれました。トレーダーが内容を確認・検証できるようにという配慮です。作者に拍手を送りましょう!無料で利用できますが、コードの再公開はハウスルールに従う必要があります。

免責事項
これらの情報および投稿は、TradingViewが提供または承認する金融、投資、取引、またはその他の種類の助言もしくは推奨であることを意図したものではなく、またこれらに該当するものでもありません。詳細は利用規約をご覧ください。
オープンソーススクリプト
TradingViewの精神に則り、このスクリプトの作者はコードをオープンソースとして公開してくれました。トレーダーが内容を確認・検証できるようにという配慮です。作者に拍手を送りましょう!無料で利用できますが、コードの再公開はハウスルールに従う必要があります。
免責事項
これらの情報および投稿は、TradingViewが提供または承認する金融、投資、取引、またはその他の種類の助言もしくは推奨であることを意図したものではなく、またこれらに該当するものでもありません。詳細は利用規約をご覧ください。