OPEN-SOURCE SCRIPT
6 EMA 20 EMA Crossover Alert
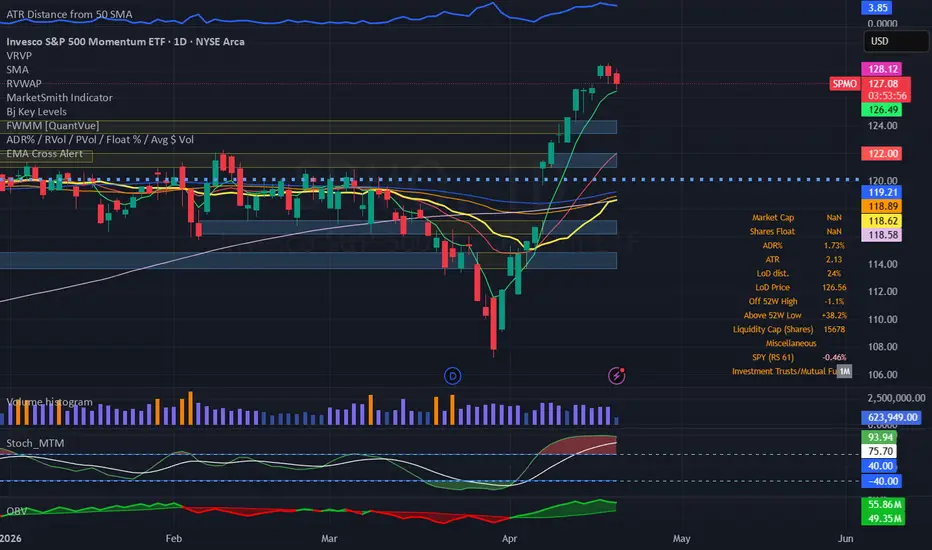
6 EMA 20 EMA Crossover Alert
The 6 EMA / 20 EMA setup is a simple trend-following tool using two exponential moving averages on a chart in TradingView.
The 6 EMA reacts quickly to price and tracks short-term momentum. The 20 EMA moves slower and represents the broader, short-term trend.
When the 6 EMA crosses above the 20 EMA, it suggests momentum is turning bullish. When it crosses below, it signals potential bearish momentum.
In plain English, it’s a quick way to see when short-term price action is starting to overpower the current trend.
オープンソーススクリプト
TradingViewの精神に則り、このスクリプトの作者はコードをオープンソースとして公開してくれました。トレーダーが内容を確認・検証できるようにという配慮です。作者に拍手を送りましょう!無料で利用できますが、コードの再公開はハウスルールに従う必要があります。

免責事項
これらの情報および投稿は、TradingViewが提供または承認する金融、投資、取引、またはその他の種類の助言もしくは推奨であることを意図したものではなく、またこれらに該当するものでもありません。詳細は利用規約をご覧ください。
オープンソーススクリプト
TradingViewの精神に則り、このスクリプトの作者はコードをオープンソースとして公開してくれました。トレーダーが内容を確認・検証できるようにという配慮です。作者に拍手を送りましょう!無料で利用できますが、コードの再公開はハウスルールに従う必要があります。
免責事項
これらの情報および投稿は、TradingViewが提供または承認する金融、投資、取引、またはその他の種類の助言もしくは推奨であることを意図したものではなく、またこれらに該当するものでもありません。詳細は利用規約をご覧ください。