OPEN-SOURCE SCRIPT
更新済 Relative Strength Index RSI FREE , Multi-Timeframe MTF //BPS
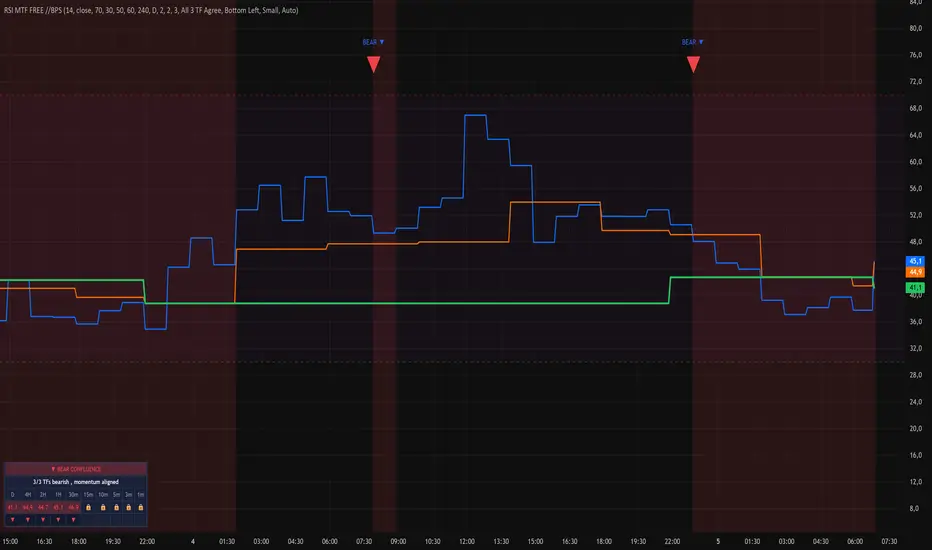
Multi-timeframe RSI with up to three timeframes plotted
simultaneously plus a 10-timeframe trend-confluence dashboard.
📊 WHAT IT SHOWS
• Up to 3 RSI lines on chart from independent timeframes
• 10-timeframe dashboard (D → 1m) with RSI values + direction arrows
• Configurable overbought / oversold / middle levels
• Confluence signals when 2 or 3 TFs agree (BULL ▲ / BEAR ▼)
• Optional background highlight on trend confluence
🎯 HOW TO USE
• Trade in direction of higher TF — only long when 4h+ RSI > 50
• Wait for confluence — all 3 TFs agreeing = high-probability setup
• Look for RSI divergence on HTF combined with oversold on LTF for entries
• Use as a filter, not a trigger — pair with structure breaks
🔑 KEYWORDS
RSI, Relative Strength Index, Multi-Timeframe RSI, MTF RSI, RSI
Divergence, Overbought, Oversold, Confluence, RSI Dashboard,
Wilder, Momentum Oscillator
simultaneously plus a 10-timeframe trend-confluence dashboard.
📊 WHAT IT SHOWS
• Up to 3 RSI lines on chart from independent timeframes
• 10-timeframe dashboard (D → 1m) with RSI values + direction arrows
• Configurable overbought / oversold / middle levels
• Confluence signals when 2 or 3 TFs agree (BULL ▲ / BEAR ▼)
• Optional background highlight on trend confluence
🎯 HOW TO USE
• Trade in direction of higher TF — only long when 4h+ RSI > 50
• Wait for confluence — all 3 TFs agreeing = high-probability setup
• Look for RSI divergence on HTF combined with oversold on LTF for entries
• Use as a filter, not a trigger — pair with structure breaks
🔑 KEYWORDS
RSI, Relative Strength Index, Multi-Timeframe RSI, MTF RSI, RSI
Divergence, Overbought, Oversold, Confluence, RSI Dashboard,
Wilder, Momentum Oscillator
リリースノート
Fullscreen Previewオープンソーススクリプト
TradingViewの精神に則り、このスクリプトの作者はコードをオープンソースとして公開してくれました。トレーダーが内容を確認・検証できるようにという配慮です。作者に拍手を送りましょう!無料で利用できますが、コードの再公開はハウスルールに従う必要があります。

Try 3 days free
免責事項
これらの情報および投稿は、TradingViewが提供または承認する金融、投資、取引、またはその他の種類の助言もしくは推奨であることを意図したものではなく、またこれらに該当するものでもありません。詳細は利用規約をご覧ください。
オープンソーススクリプト
TradingViewの精神に則り、このスクリプトの作者はコードをオープンソースとして公開してくれました。トレーダーが内容を確認・検証できるようにという配慮です。作者に拍手を送りましょう!無料で利用できますが、コードの再公開はハウスルールに従う必要があります。
Try 3 days free
免責事項
これらの情報および投稿は、TradingViewが提供または承認する金融、投資、取引、またはその他の種類の助言もしくは推奨であることを意図したものではなく、またこれらに該当するものでもありません。詳細は利用規約をご覧ください。