OPEN-SOURCE SCRIPT
Adaptive Spectral Bands [JOAT]
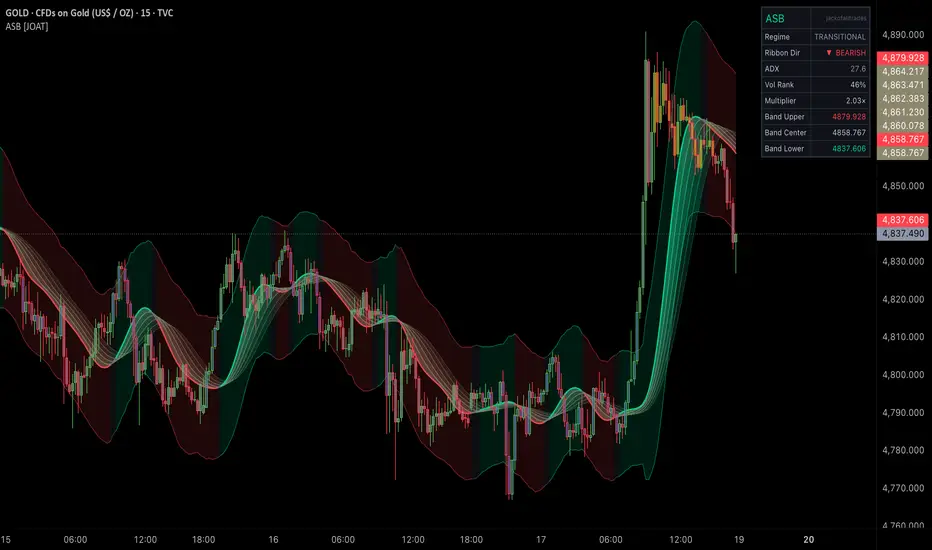
Adaptive Spectral Bands [JOAT]
Introduction
The Adaptive Spectral Bands indicator is a six-layer Hann Window FIR filter ribbon combined with volatility-adaptive ATR envelopes, a three-state regime classifier, and automated support/resistance zone discovery. The Hann window is a well-known digital signal processing technique that applies a raised cosine weighting function to price data, producing a filter with near-zero overshoot and a steep frequency rolloff. The result is a smoothed trend line that turns earlier at genuine inflection points without the lag spikes characteristic of exponential moving averages.
The core problem this solves: standard moving average ribbons use EMAs or SMAs which introduce phase lag proportional to their length, creating late entries. The Hann FIR ribbon resolves at the mathematically optimal balance between lag reduction and frequency separation — no other common moving average achieves this simultaneously.

Core Concepts
1. Hann Window FIR Filter
The filter applies raised cosine weights across a lookback window. Each weight is computed as:
Pine Script®
This produces a symmetric bell-shaped kernel. The six ribbon layers use progressively wider copies of this filter (base length, base + spacing, base + 2×spacing, etc.), creating a ribbon that visually encodes trend momentum — wide separations signal strong trends, compression signals consolidation.
2. Volatility-Adaptive ATR Bands
The outer bands expand and contract based on the current volatility percentile rank relative to a lookback period. This is not a fixed-multiplier Bollinger Band — the multiplier itself adapts:
Pine Script®
During compression (low ADX, low ATR rank), bands tighten around the central Hann line. During expansion, bands widen, automatically containing breakout candles within the volatility envelope. This eliminates the problem of static bands that produce false breakouts in trending markets.
3. Three-State Volatility Regime Classifier
ADX is used as the regime signal, with two configurable thresholds:
The background and candle colors change with regime, providing at-a-glance context without requiring a separate ADX panel.
4. Automated S/R Zone Discovery
When the leading Hann layer crosses the second layer, the local price extreme at that bar is recorded as a support or resistance level. These crossovers mark inflection points where trend direction is shifting — the price level at that bar frequently becomes a structural reference in subsequent sessions:
Pine Script®
Zones are spaced by a minimum bar count to avoid clustering. Old zones are managed by a shift-and-delete array pattern so the chart stays clean.
Features
Input Parameters
Hann Filter:
Adaptive Bands:
Volatility Regime:
S/R Zones:
Visualization:
Dashboard:

How to Use This Indicator
Step 1: Identify the Regime
The dashboard shows the current regime label (Compression / Transitional / Expansion) and the ADX value. In compression, wait. In expansion, trade. The volatility rank shows where current ATR sits in its historical distribution — above 70th percentile is high volatility.
Step 2: Read the Ribbon Direction
When h0 (fastest layer) is above h1 and h1 above h2, the ribbon is bullish and fully aligned. A crossover of h0 over h1 is the initial signal; a full stack alignment is the confirmation.
Step 3: Respect the Adaptive Bands
Price touching the upper band in expansion often marks a continuation point — the band is expanding to contain the trend. The same touch during compression is a fade signal. The regime state determines which interpretation applies.
Step 4: Trade S/R Zone Retests
When price retraces to a recently discovered S/R zone, look for ribbon alignment in the same direction as the original break. The zone marks where the Hann crossover occurred, which is the most statistically significant structural inflection point available from the ribbon.
Originality Statement
This indicator is original in its combination of Hann Window FIR filter ribbons with adaptive ATR bands and regime-conditioned S/R zone discovery. Its use on TradingView is justified because:
Limitations
Disclaimer
This indicator is provided for educational and informational purposes only. It does not constitute financial advice or a recommendation to buy or sell any instrument. All trading involves risk of loss. Past performance of structural patterns does not guarantee future results. Always use proper risk management.
-Made with passion by jackofalltrades
Introduction
The Adaptive Spectral Bands indicator is a six-layer Hann Window FIR filter ribbon combined with volatility-adaptive ATR envelopes, a three-state regime classifier, and automated support/resistance zone discovery. The Hann window is a well-known digital signal processing technique that applies a raised cosine weighting function to price data, producing a filter with near-zero overshoot and a steep frequency rolloff. The result is a smoothed trend line that turns earlier at genuine inflection points without the lag spikes characteristic of exponential moving averages.
The core problem this solves: standard moving average ribbons use EMAs or SMAs which introduce phase lag proportional to their length, creating late entries. The Hann FIR ribbon resolves at the mathematically optimal balance between lag reduction and frequency separation — no other common moving average achieves this simultaneously.
Core Concepts
1. Hann Window FIR Filter
The filter applies raised cosine weights across a lookback window. Each weight is computed as:
This produces a symmetric bell-shaped kernel. The six ribbon layers use progressively wider copies of this filter (base length, base + spacing, base + 2×spacing, etc.), creating a ribbon that visually encodes trend momentum — wide separations signal strong trends, compression signals consolidation.
2. Volatility-Adaptive ATR Bands
The outer bands expand and contract based on the current volatility percentile rank relative to a lookback period. This is not a fixed-multiplier Bollinger Band — the multiplier itself adapts:
During compression (low ADX, low ATR rank), bands tighten around the central Hann line. During expansion, bands widen, automatically containing breakout candles within the volatility envelope. This eliminates the problem of static bands that produce false breakouts in trending markets.
3. Three-State Volatility Regime Classifier
ADX is used as the regime signal, with two configurable thresholds:
- Low Volatility / Compression: ADX below lower threshold. Ribbon layers are tightly stacked. Market is in accumulation or range contraction. Fade-the-band strategies may apply.
- Transitional: ADX between thresholds. Directional conviction is building. Ribbon is beginning to separate.
- Expansion / Trending: ADX above upper threshold. Ribbon layers are fully separated. Breakout confirmation. Momentum strategies applicable.
The background and candle colors change with regime, providing at-a-glance context without requiring a separate ADX panel.
4. Automated S/R Zone Discovery
When the leading Hann layer crosses the second layer, the local price extreme at that bar is recorded as a support or resistance level. These crossovers mark inflection points where trend direction is shifting — the price level at that bar frequently becomes a structural reference in subsequent sessions:
Zones are spaced by a minimum bar count to avoid clustering. Old zones are managed by a shift-and-delete array pattern so the chart stays clean.
Features
- Six-Layer Hann Ribbon: Progressively wider FIR filters creating a gradient ribbon from fast to slow
- Adaptive ATR Bands: Volatility-rank-adjusted envelopes that breathe with market conditions
- Three-State Regime Classifier: Low / Transitional / Expansion states with color coding
- Auto S/R Zones: Ribbon crossover points recorded as support/resistance boxes with configurable spacing
- Candle Coloring: Optional bar tinting by volatility regime (compression blue / expansion amber)
- 10-Row Dashboard: Displays regime label, ADX value, volatility rank, ribbon direction, band width, active S/R zone count, and more
- Alerts: Ribbon crossover bullish, ribbon crossover bearish, regime change to expansion, regime change to compression
Input Parameters
Hann Filter:
- Source: Price input for the filter (default: close)
- Base Length: Core period of the Hann FIR filter (default: 20, range: 4–500). The six ribbon layers are derived from this.
- Ribbon Spacing: Gap between each successive ribbon layer (default: 3). Larger values create a wider, more visible ribbon.
- Show Ribbon: Toggle ribbon visibility (default: on)
Adaptive Bands:
- Enable Adaptive Bands: Toggle ATR envelope rendering (default: on)
- Base Multiplier: Core ATR distance for the bands (default: 2.0)
- Volatility Lookback: Period for ATR percentile rank calculation (default: 50)
- Adaptation Strength: 0 = fixed multiplier, 1 = maximum volatility adaptation (default: 0.4)
Volatility Regime:
- ADX Length: Period for ADX computation (default: 14)
- Low Threshold: ADX below this = Compression regime (default: 20)
- High Threshold: ADX above this = Expansion regime (default: 35)
S/R Zones:
- Auto S/R Zones: Enable ribbon-crossover-based zone discovery (default: on)
- Min Zone Spacing: Minimum bar distance between consecutive S/R zones (default: 30)
Visualization:
- Bullish / Bearish / Compression / Expansion colors: Fully customizable
- Color Candles by Regime: Optional regime-based candle tinting (default: off)
Dashboard:
- Position: Top Right, Top Left, Bottom Right, Bottom Left (default: Top Right)
How to Use This Indicator
Step 1: Identify the Regime
The dashboard shows the current regime label (Compression / Transitional / Expansion) and the ADX value. In compression, wait. In expansion, trade. The volatility rank shows where current ATR sits in its historical distribution — above 70th percentile is high volatility.
Step 2: Read the Ribbon Direction
When h0 (fastest layer) is above h1 and h1 above h2, the ribbon is bullish and fully aligned. A crossover of h0 over h1 is the initial signal; a full stack alignment is the confirmation.
Step 3: Respect the Adaptive Bands
Price touching the upper band in expansion often marks a continuation point — the band is expanding to contain the trend. The same touch during compression is a fade signal. The regime state determines which interpretation applies.
Step 4: Trade S/R Zone Retests
When price retraces to a recently discovered S/R zone, look for ribbon alignment in the same direction as the original break. The zone marks where the Hann crossover occurred, which is the most statistically significant structural inflection point available from the ribbon.
Originality Statement
This indicator is original in its combination of Hann Window FIR filter ribbons with adaptive ATR bands and regime-conditioned S/R zone discovery. Its use on TradingView is justified because:
- The Hann FIR filter produces strictly lower phase lag at equivalent frequency cutoff than EMA or DEMA — a mathematically demonstrable property that common Pine implementations do not exploit
- Volatility percentile rank as the band multiplier modulator creates self-regulating envelopes that require no manual retuning between high and low volatility periods
- Combining ADX regime state with ribbon structure separates directional signals from noise — the same crossover signal carries different weight in compression versus expansion
- Auto S/R zone discovery from FIR crossovers creates an objective level-finding method anchored to frequency-domain turning points, not arbitrary pivot lookbacks
Limitations
- The Hann FIR filter is a causal, finite impulse response filter — it responds to all price history within its window equally weighted by the cosine kernel. It cannot predict future turning points; it identifies them as they occur.
- ADX is a lagging indicator. Regime classification based on ADX will sometimes enter expansion state after the move has partially occurred.
- Auto S/R zones are derived from ribbon crossovers, which means they lag the actual price turn by the filter's inherent smoothing delay. Zones mark inflection areas, not exact price pivots.
- On very short timeframes (sub-5m), Hann filter smoothing may be excessive relative to the noise level, making regime signals less reliable.
Disclaimer
This indicator is provided for educational and informational purposes only. It does not constitute financial advice or a recommendation to buy or sell any instrument. All trading involves risk of loss. Past performance of structural patterns does not guarantee future results. Always use proper risk management.
-Made with passion by jackofalltrades
オープンソーススクリプト
TradingViewの精神に則り、このスクリプトの作者はコードをオープンソースとして公開してくれました。トレーダーが内容を確認・検証できるようにという配慮です。作者に拍手を送りましょう!無料で利用できますが、コードの再公開はハウスルールに従う必要があります。

The AI Trading Ecosystem, Built to win trades 📈
Get Full Access 👇
jackofalltrades.vip 🌐
t.me/jackofalltradesvip 🃏
Get Full Access 👇
jackofalltrades.vip 🌐
t.me/jackofalltradesvip 🃏
免責事項
これらの情報および投稿は、TradingViewが提供または承認する金融、投資、取引、またはその他の種類の助言もしくは推奨であることを意図したものではなく、またこれらに該当するものでもありません。詳細は利用規約をご覧ください。
オープンソーススクリプト
TradingViewの精神に則り、このスクリプトの作者はコードをオープンソースとして公開してくれました。トレーダーが内容を確認・検証できるようにという配慮です。作者に拍手を送りましょう!無料で利用できますが、コードの再公開はハウスルールに従う必要があります。
The AI Trading Ecosystem, Built to win trades 📈
Get Full Access 👇
jackofalltrades.vip 🌐
t.me/jackofalltradesvip 🃏
Get Full Access 👇
jackofalltrades.vip 🌐
t.me/jackofalltradesvip 🃏
免責事項
これらの情報および投稿は、TradingViewが提供または承認する金融、投資、取引、またはその他の種類の助言もしくは推奨であることを意図したものではなく、またこれらに該当するものでもありません。詳細は利用規約をご覧ください。