OPEN-SOURCE SCRIPT
更新済 HTF Gap Zones + MA Suite
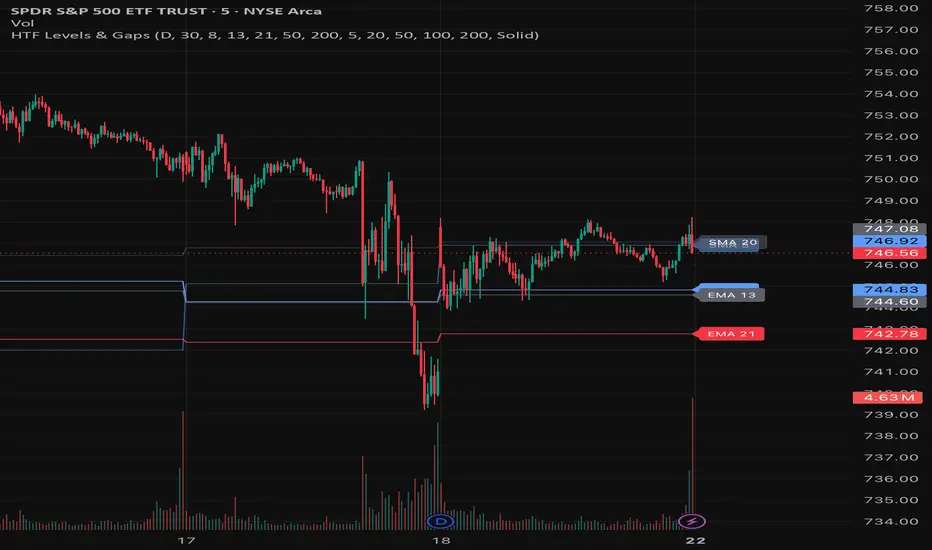
This indicator plots higher-timeframe moving averages and highlights unfilled gap zones directly on your current chart.
It uses a configurable anchor timeframe, such as Daily or Weekly, to calculate EMA and SMA levels while allowing you to view them on lower timeframes. This helps traders keep key higher-timeframe structure visible without constantly switching charts.
The script also scans recent higher-timeframe candles for bullish and bearish gaps. Only unclosed gaps are displayed, making it easier to identify potential areas of interest, imbalance, support, resistance, or price reaction zones.
Features:
Configurable higher-timeframe anchor
Detects bullish and bearish unfilled HTF gaps
Adjustable gap lookback
Custom bullish and bearish gap colors
Five customizable EMAs
Five customizable SMAs
Optional labels for moving averages
Solid, dotted, or dashed visual style
Designed to keep higher-timeframe context visible on intraday charts
This tool is useful for traders who want to combine higher-timeframe structure, gap/imbalance zones, and trend-following moving averages in one clean overlay.
It uses a configurable anchor timeframe, such as Daily or Weekly, to calculate EMA and SMA levels while allowing you to view them on lower timeframes. This helps traders keep key higher-timeframe structure visible without constantly switching charts.
The script also scans recent higher-timeframe candles for bullish and bearish gaps. Only unclosed gaps are displayed, making it easier to identify potential areas of interest, imbalance, support, resistance, or price reaction zones.
Features:
Configurable higher-timeframe anchor
Detects bullish and bearish unfilled HTF gaps
Adjustable gap lookback
Custom bullish and bearish gap colors
Five customizable EMAs
Five customizable SMAs
Optional labels for moving averages
Solid, dotted, or dashed visual style
Designed to keep higher-timeframe context visible on intraday charts
This tool is useful for traders who want to combine higher-timeframe structure, gap/imbalance zones, and trend-following moving averages in one clean overlay.
リリースノート
Updated the publication chart to better comply with TradingView’s chart publishing rules.The chart has been cleaned up by removing unrelated scripts and visual clutter, so the indicator’s output is easier to identify and understand.
No functional changes were made to the indicator logic in this update.
オープンソーススクリプト
TradingViewの精神に則り、このスクリプトの作者はコードをオープンソースとして公開してくれました。トレーダーが内容を確認・検証できるようにという配慮です。作者に拍手を送りましょう!無料で利用できますが、コードの再公開はハウスルールに従う必要があります。

免責事項
これらの情報および投稿は、TradingViewが提供または承認する金融、投資、取引、またはその他の種類の助言もしくは推奨であることを意図したものではなく、またこれらに該当するものでもありません。詳細は利用規約をご覧ください。
オープンソーススクリプト
TradingViewの精神に則り、このスクリプトの作者はコードをオープンソースとして公開してくれました。トレーダーが内容を確認・検証できるようにという配慮です。作者に拍手を送りましょう!無料で利用できますが、コードの再公開はハウスルールに従う必要があります。
免責事項
これらの情報および投稿は、TradingViewが提供または承認する金融、投資、取引、またはその他の種類の助言もしくは推奨であることを意図したものではなく、またこれらに該当するものでもありません。詳細は利用規約をご覧ください。