OPEN-SOURCE SCRIPT
更新済 Candlestick Dashboard
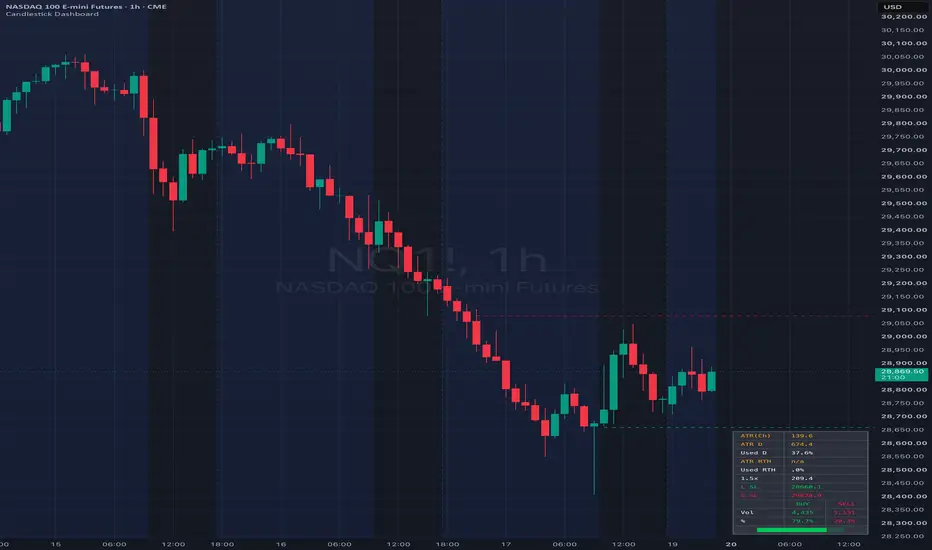
Combining ATR-based stop loss levels with buy/sell volume analysis for the current candle.
Features
- ATR value with configurable length, multiplier, and timeframe lock
- Long and short stop loss prices with chart lines that trace back to the last candle at that level
- Contract counts for buy and sell volume for the current candle
- Percentage breakdown with visual ratio bar
- Fully configurable colors, sizing, line styles, and position (9 grid locations)
- Every section independently toggleable
Works on any instrument and timeframe.
Features
- ATR value with configurable length, multiplier, and timeframe lock
- Long and short stop loss prices with chart lines that trace back to the last candle at that level
- Contract counts for buy and sell volume for the current candle
- Percentage breakdown with visual ratio bar
- Fully configurable colors, sizing, line styles, and position (9 grid locations)
- Every section independently toggleable
Works on any instrument and timeframe.
リリースノート
Added session start time and timezone options.Added percentage of ATR currently used for the session.
リリースノート
- Fixed issues with ATR percentages to be based on the daily value- Defaulted dashboard to "small"
- Changed alignment in table cells
リリースノート
Added Daily ATR and RTH ATR rangesリリースノート
Actually show the ATR valuesオープンソーススクリプト
TradingViewの精神に則り、このスクリプトの作者はコードをオープンソースとして公開してくれました。トレーダーが内容を確認・検証できるようにという配慮です。作者に拍手を送りましょう!無料で利用できますが、コードの再公開はハウスルールに従う必要があります。

免責事項
これらの情報および投稿は、TradingViewが提供または承認する金融、投資、取引、またはその他の種類の助言もしくは推奨であることを意図したものではなく、またこれらに該当するものでもありません。詳細は利用規約をご覧ください。
オープンソーススクリプト
TradingViewの精神に則り、このスクリプトの作者はコードをオープンソースとして公開してくれました。トレーダーが内容を確認・検証できるようにという配慮です。作者に拍手を送りましょう!無料で利用できますが、コードの再公開はハウスルールに従う必要があります。
免責事項
これらの情報および投稿は、TradingViewが提供または承認する金融、投資、取引、またはその他の種類の助言もしくは推奨であることを意図したものではなく、またこれらに該当するものでもありません。詳細は利用規約をご覧ください。