OPEN-SOURCE SCRIPT
Macro Candle Overlay
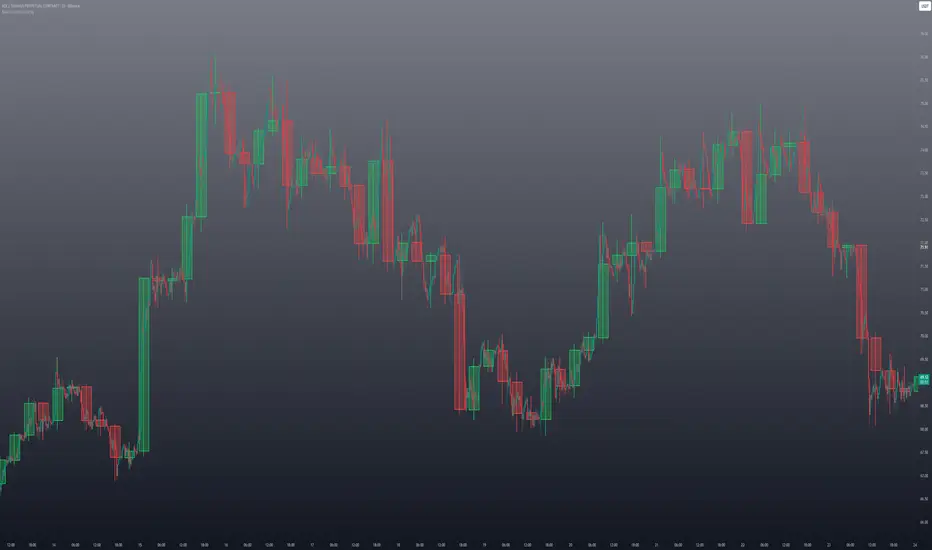
Macro Candle Overlay is a higher-timeframe candle visualization tool designed to display selected macro candles directly on the active chart.
The script draws candles from a selected higher timeframe, such as 15m, 30m, 1H, 2H, 4H, Daily, Weekly, or Monthly. Each higher-timeframe candle is represented with its own body and wick, allowing traders to view larger candle structure without switching away from the current chart timeframe.
This can help with visual analysis of broader market context, including higher-timeframe candle direction, wick behavior, candle body size, and developing macro candle structure.
Main features:
* Higher-timeframe candle overlay on the current chart;
* Selectable candle timeframe;
* Bullish and bearish body color settings;
* Wick and border color settings;
* Adjustable body transparency;
* Automatic candle updating while the current higher-timeframe candle is still developing;
* Clean chart-based visualization with no signal logic.
How it works:
The indicator uses the selected higher timeframe to define candle open, high, low, close, start time, and end time. It then draws each candle as a chart object, including a candle body and a wick. The active candle updates as new price data appears.
This script does not generate buy or sell signals. It does not include strategy logic, alerts, backtesting, win-rate calculations, or performance projections. It is intended only as a visual charting tool for reading higher-timeframe candle structure.
Traders can use it as an additional visual reference together with their own analysis, market structure, risk management, and trading plan.
The script draws candles from a selected higher timeframe, such as 15m, 30m, 1H, 2H, 4H, Daily, Weekly, or Monthly. Each higher-timeframe candle is represented with its own body and wick, allowing traders to view larger candle structure without switching away from the current chart timeframe.
This can help with visual analysis of broader market context, including higher-timeframe candle direction, wick behavior, candle body size, and developing macro candle structure.
Main features:
* Higher-timeframe candle overlay on the current chart;
* Selectable candle timeframe;
* Bullish and bearish body color settings;
* Wick and border color settings;
* Adjustable body transparency;
* Automatic candle updating while the current higher-timeframe candle is still developing;
* Clean chart-based visualization with no signal logic.
How it works:
The indicator uses the selected higher timeframe to define candle open, high, low, close, start time, and end time. It then draws each candle as a chart object, including a candle body and a wick. The active candle updates as new price data appears.
This script does not generate buy or sell signals. It does not include strategy logic, alerts, backtesting, win-rate calculations, or performance projections. It is intended only as a visual charting tool for reading higher-timeframe candle structure.
Traders can use it as an additional visual reference together with their own analysis, market structure, risk management, and trading plan.
オープンソーススクリプト
TradingViewの精神に則り、このスクリプトの作者はコードをオープンソースとして公開してくれました。トレーダーが内容を確認・検証できるようにという配慮です。作者に拍手を送りましょう!無料で利用できますが、コードの再公開はハウスルールに従う必要があります。

CT Community from Lithuania: cryptoimperija.com
All content provided by Crypto Imperija is for informational and educational purposes only. Past performance does not guarantee future results.
All content provided by Crypto Imperija is for informational and educational purposes only. Past performance does not guarantee future results.
免責事項
これらの情報および投稿は、TradingViewが提供または承認する金融、投資、取引、またはその他の種類の助言もしくは推奨であることを意図したものではなく、またこれらに該当するものでもありません。詳細は利用規約をご覧ください。
オープンソーススクリプト
TradingViewの精神に則り、このスクリプトの作者はコードをオープンソースとして公開してくれました。トレーダーが内容を確認・検証できるようにという配慮です。作者に拍手を送りましょう!無料で利用できますが、コードの再公開はハウスルールに従う必要があります。
CT Community from Lithuania: cryptoimperija.com
All content provided by Crypto Imperija is for informational and educational purposes only. Past performance does not guarantee future results.
All content provided by Crypto Imperija is for informational and educational purposes only. Past performance does not guarantee future results.
免責事項
これらの情報および投稿は、TradingViewが提供または承認する金融、投資、取引、またはその他の種類の助言もしくは推奨であることを意図したものではなく、またこれらに該当するものでもありません。詳細は利用規約をご覧ください。