アップデート済
Willams %R with 13 EMA - TRI
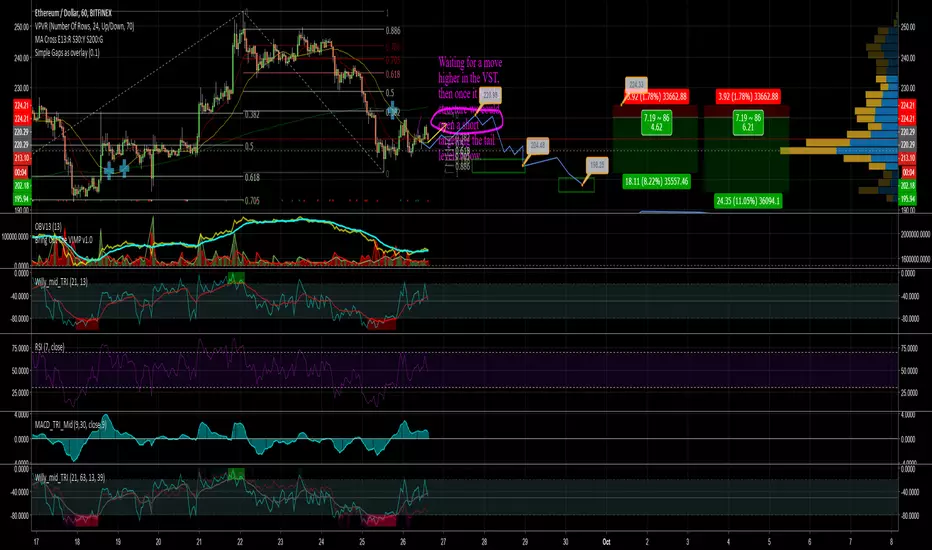
Based on alexpunct's work.
I simply added a second Willy plot and EMA which allows you to plot Willy and its EMA for a second time frame on the same chart.
The idea is that you will only enter a trade if there is confluence on the two time frames i.e. Willy is stupidly oversold/overbought on both the 4h and 12h or 1h and 4h time frames.
I will be testing this and will adapt
I simply added a second Willy plot and EMA which allows you to plot Willy and its EMA for a second time frame on the same chart.
The idea is that you will only enter a trade if there is confluence on the two time frames i.e. Willy is stupidly oversold/overbought on both the 4h and 12h or 1h and 4h time frames.
I will be testing this and will adapt
リリースノート
Fixed some little errors and added correct subtitles
免責事項
これらの情報および投稿は、TradingViewが提供または承認する金融、投資、取引、またはその他の種類の助言もしくは推奨であることを意図したものではなく、またこれらに該当するものでもありません。詳細は利用規約をご覧ください。
免責事項
これらの情報および投稿は、TradingViewが提供または承認する金融、投資、取引、またはその他の種類の助言もしくは推奨であることを意図したものではなく、またこれらに該当するものでもありません。詳細は利用規約をご覧ください。