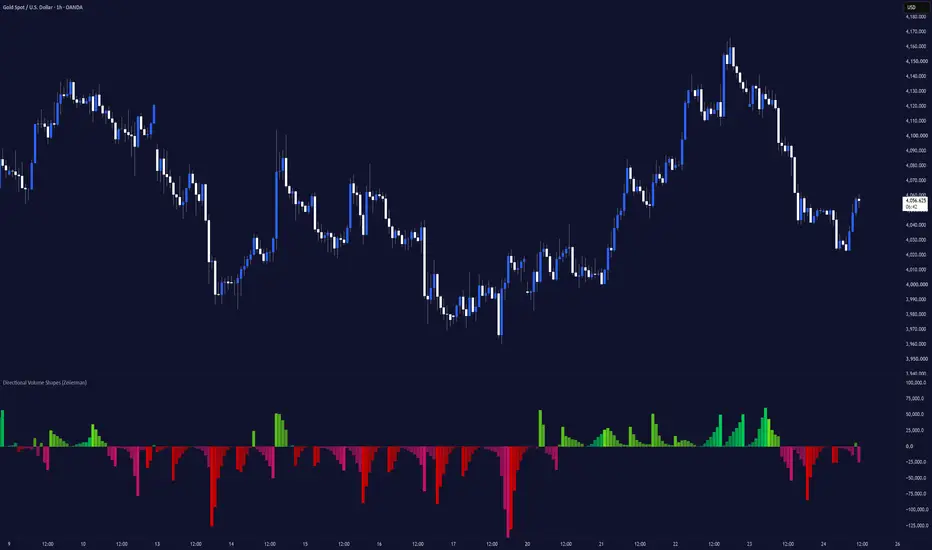
█ Overview
Directional Volume Shapes (Zeiierman) is a regime-classification oscillator that reframes volume analysis around a different question: not simply “how much volume traded,” but “what statistical shape has directional pressure been forming, and which way is it leaning?”
Instead of plotting raw buy and sell volume bar by bar, the indicator scores each candle for directional pressure using a triangular intrabar distribution model. It collects those scores in a rolling window, classifies the pattern into one of seven distribution shapes, and displays a smooth synthetic template of the detected shape.
The result is less like a traditional volume indicator and more like a distribution-regime display, showing the type of pressure environment currently developing.

⚪ Why Is This One Unique?
Most volume tools show exactly what happened: green bar up, red bar down, and taller bar equals more volume. This indicator uses a two-stage process: classify, then synthesize.
It combines:
• A triangular CDF candle scorer that estimates directional pressure from OHLC data
• A rolling shape classifier using skewness, Gaussian-smoothed peak detection, and time correlation
• Seven possible classifications: Bell, Right-skewed, Left-skewed, J-shaped, Reverse-J, Bimodal, and Multimodal
• A template generator that displays an idealized mathematical version of the active shape
• A separate EMA-based polarity engine that controls bullish or bearish direction

█ How It Works
⚪ 1. Scores Each Candle’s Directional Pressure
Instead of using a simple “close above open equals bullish” rule, the indicator models the candle’s high-low range as a triangular probability distribution centered at the close.
The scr() function evaluates the candle’s full OHLC structure and returns a value between 0 and 1. That result is then converted into a signed pressure score between -1 and +1.
Pine Script®
Values near +1 represent stronger bullish pressure, while values near -1 represent stronger bearish pressure. Values near zero indicate a more balanced candle.
⚪ 2. Optionally Weights Pressure by Volume
When Volume Weighting is enabled, the pressure score is multiplied by raw volume.
Pine Script®
This gives high-volume bars more influence over the rolling shape-classification window. When disabled, the classifier uses directional pressure alone.
Volume still controls the height of the plotted columns regardless of this setting.
⚪ 3. Classifies Pressure Shape, Not Direction
The indicator stores recent pressure values in a rolling window. Before classification, it converts each value into its absolute magnitude.
Pine Script®
Using math.abs() removes bullish and bearish direction from the classification stage. The classifier analyzes how pressure strength has been distributed, not which direction it points.
It measures:
• Skewness in the raw pressure magnitudes
• Local peaks in a Gaussian-smoothed version of the data
• Whether pressure strength is generally increasing or decreasing through time
The final shape is selected using a fixed priority order:
Pine Script®
Multiple peaks are checked first, followed by rising or falling behavior, then skewness. Bell is used when no other condition is detected.
⚪ 4. Requires Persistence Before Changing Shapes
The active shape changes only after five consecutive bars produce a classification different from the shape currently displayed.
Pine Script®
The five classifications do not need to match each other. They only need to differ from the current active shape.
When the fifth differing classification arrives, the indicator switches to that bar’s shape and restarts the template cycle.
⚪ 5. Tracks Polarity Separately
Bullish or bearish polarity is calculated independently from the shape classification.
A short EMA is applied to the original signed pressure score:
Pine Script®
When the EMA is above or equal to zero, polarity is Bull. When it is below zero, polarity is Bear.
Because polarity can change as soon as the EMA crosses zero, it usually reacts faster than the shape classifier.
⚪ 6. Displays a Synthetic Shape Template
Once a shape is selected, the indicator does not plot the original pressure values.
Instead, it generates an idealized mathematical template for the active shape. For example, Bell uses a Gaussian curve, J-shaped uses a squared rising curve, and Bimodal combines two separate Gaussian peaks.
The generated template is then scaled by recent average volume and signed according to polarity.
Pine Script®
The template advances by a fixed amount on each bar. Template Cycle Length controls how many bars are used to complete one full cycle.
█ Assumptions We Are Explicitly Making
█ How to Use
⚪ Directional Volume Reading
Use the indicator as you would a traditional volume oscillator.
• Readings above zero indicate bullish volume strength.
• Readings below zero indicate bearish volume strength.

⚪ Divergences
Use the columns to identify divergences in volume strength.
• Bullish divergence: Price makes a lower low while the indicator forms a higher low.
• Bearish divergence: Price makes a higher high while the indicator forms a lower high.

⚪ Interpreting the Shape Labels
• Bell: Pressure intensity is relatively symmetric and contains one main area of activity.
• Right-skewed / Left-skewed: Pressure intensity is uneven and has a longer tail on one side of the distribution.
• J-shaped: Pressure intensity has generally increased toward the most recent bars.
• Reverse-J: Pressure intensity was stronger earlier in the window and has weakened toward the present.
• Bimodal / Multimodal: The smoothed pressure path contains two or more separate periods of stronger activity within the detection window.

⚪ Choosing the Shape Speed
Template Cycle Length controls how quickly the displayed shape moves through its synthetic cycle. It changes the visual speed of the columns, not the shape-detection window or Bull/Bear polarity.
• 3 bars, Fast: Creates tight, fast-moving shapes. This is the most responsive and active-looking setting.
• 4 bars, Balanced: Gives each shape slightly more time to develop while remaining responsive.
• 5 to 7 bars, Slow: Stretches the shape across more bars, creating smoother and slower visual cycles.
A value of 3 is useful when you prefer compact, fast-moving shapes. Increase the value when you want each shape to develop more gradually and remain visible for longer.
█ Settings
-----------------
Disclaimer
The content provided in my scripts, indicators, ideas, algorithms, and systems is for educational and informational purposes only. It does not constitute financial advice, investment recommendations, or a solicitation to buy or sell any financial instruments. I will not accept liability for any loss or damage, including without limitation any loss of profit, which may arise directly or indirectly from the use of or reliance on such information.
All investments involve risk, and the past performance of a security, industry, sector, market, financial product, trading strategy, backtest, or individual's trading does not guarantee future results or returns. Investors are fully responsible for any investment decisions they make. Such decisions should be based solely on an evaluation of their financial circumstances, investment objectives, risk tolerance, and liquidity needs.
Directional Volume Shapes (Zeiierman) is a regime-classification oscillator that reframes volume analysis around a different question: not simply “how much volume traded,” but “what statistical shape has directional pressure been forming, and which way is it leaning?”
Instead of plotting raw buy and sell volume bar by bar, the indicator scores each candle for directional pressure using a triangular intrabar distribution model. It collects those scores in a rolling window, classifies the pattern into one of seven distribution shapes, and displays a smooth synthetic template of the detected shape.
The result is less like a traditional volume indicator and more like a distribution-regime display, showing the type of pressure environment currently developing.
⚪ Why Is This One Unique?
Most volume tools show exactly what happened: green bar up, red bar down, and taller bar equals more volume. This indicator uses a two-stage process: classify, then synthesize.
It combines:
• A triangular CDF candle scorer that estimates directional pressure from OHLC data
• A rolling shape classifier using skewness, Gaussian-smoothed peak detection, and time correlation
• Seven possible classifications: Bell, Right-skewed, Left-skewed, J-shaped, Reverse-J, Bimodal, and Multimodal
• A template generator that displays an idealized mathematical version of the active shape
• A separate EMA-based polarity engine that controls bullish or bearish direction
█ How It Works
⚪ 1. Scores Each Candle’s Directional Pressure
Instead of using a simple “close above open equals bullish” rule, the indicator models the candle’s high-low range as a triangular probability distribution centered at the close.
The scr() function evaluates the candle’s full OHLC structure and returns a value between 0 and 1. That result is then converted into a signed pressure score between -1 and +1.
Values near +1 represent stronger bullish pressure, while values near -1 represent stronger bearish pressure. Values near zero indicate a more balanced candle.
⚪ 2. Optionally Weights Pressure by Volume
When Volume Weighting is enabled, the pressure score is multiplied by raw volume.
This gives high-volume bars more influence over the rolling shape-classification window. When disabled, the classifier uses directional pressure alone.
Volume still controls the height of the plotted columns regardless of this setting.
⚪ 3. Classifies Pressure Shape, Not Direction
The indicator stores recent pressure values in a rolling window. Before classification, it converts each value into its absolute magnitude.
Using math.abs() removes bullish and bearish direction from the classification stage. The classifier analyzes how pressure strength has been distributed, not which direction it points.
It measures:
• Skewness in the raw pressure magnitudes
• Local peaks in a Gaussian-smoothed version of the data
• Whether pressure strength is generally increasing or decreasing through time
The final shape is selected using a fixed priority order:
Multiple peaks are checked first, followed by rising or falling behavior, then skewness. Bell is used when no other condition is detected.
⚪ 4. Requires Persistence Before Changing Shapes
The active shape changes only after five consecutive bars produce a classification different from the shape currently displayed.
The five classifications do not need to match each other. They only need to differ from the current active shape.
When the fifth differing classification arrives, the indicator switches to that bar’s shape and restarts the template cycle.
⚪ 5. Tracks Polarity Separately
Bullish or bearish polarity is calculated independently from the shape classification.
A short EMA is applied to the original signed pressure score:
When the EMA is above or equal to zero, polarity is Bull. When it is below zero, polarity is Bear.
Because polarity can change as soon as the EMA crosses zero, it usually reacts faster than the shape classifier.
⚪ 6. Displays a Synthetic Shape Template
Once a shape is selected, the indicator does not plot the original pressure values.
Instead, it generates an idealized mathematical template for the active shape. For example, Bell uses a Gaussian curve, J-shaped uses a squared rising curve, and Bimodal combines two separate Gaussian peaks.
The generated template is then scaled by recent average volume and signed according to polarity.
The template advances by a fixed amount on each bar. Template Cycle Length controls how many bars are used to complete one full cycle.
█ Assumptions We Are Explicitly Making
The indicator’s usefulness depends on whether its modeling assumptions are suitable for the instrument and timeframe being analyzed.
These are not facts about market behavior. They are simplifying assumptions used because Pine Script does not provide true intrabar tick or order-flow data.
⚪ Intrabar Activity Is Approximated With a Triangular Distribution
The model approximates intrabar activity using a triangular distribution centered at the close. It does not know where price actually spent the most time within the candle.
Using another reference point, such as VWAP, the midpoint, or the open, could produce a different pressure score.
⚪ Shape and Direction Are Treated Separately
The shape classifier analyzes the magnitude of pressure but removes its bullish or bearish direction. Two windows with similar pressure-strength patterns but opposite directional bias can therefore receive the same shape classification.
The shape describes how pressure has been distributed, while the separate polarity calculation determines whether it is leaning Bull or Bear.
⚪ Seven Shapes Are Used to Describe Pressure Behavior
Every window is placed into one of seven fixed categories using predefined thresholds:
• Skewness thresholds of ±0.1
• Correlation thresholds of ±0.5
• Peak prominence above 10% of the smoothed envelope’s maximum
The classifier follows a fixed priority order rather than selecting the mathematically closest-fitting shape.
There is also no statistical significance test behind these thresholds, so borderline classifications may change because of noise.
⚪ The Displayed Curve Represents the Classification, Not the Raw Data
After classification, the indicator displays an idealized template rather than the original pressure values. Two different pressure windows classified as Bell will use the same normalized Bell template.
The final column height and direction can still differ because the template is scaled by recent volume and signed by polarity.
█ How to Use
⚪ Directional Volume Reading
Use the indicator as you would a traditional volume oscillator.
• Readings above zero indicate bullish volume strength.
• Readings below zero indicate bearish volume strength.
⚪ Divergences
Use the columns to identify divergences in volume strength.
• Bullish divergence: Price makes a lower low while the indicator forms a higher low.
• Bearish divergence: Price makes a higher high while the indicator forms a lower high.
⚪ Interpreting the Shape Labels
• Bell: Pressure intensity is relatively symmetric and contains one main area of activity.
• Right-skewed / Left-skewed: Pressure intensity is uneven and has a longer tail on one side of the distribution.
• J-shaped: Pressure intensity has generally increased toward the most recent bars.
• Reverse-J: Pressure intensity was stronger earlier in the window and has weakened toward the present.
• Bimodal / Multimodal: The smoothed pressure path contains two or more separate periods of stronger activity within the detection window.
⚪ Choosing the Shape Speed
Template Cycle Length controls how quickly the displayed shape moves through its synthetic cycle. It changes the visual speed of the columns, not the shape-detection window or Bull/Bear polarity.
• 3 bars, Fast: Creates tight, fast-moving shapes. This is the most responsive and active-looking setting.
• 4 bars, Balanced: Gives each shape slightly more time to develop while remaining responsive.
• 5 to 7 bars, Slow: Stretches the shape across more bars, creating smoother and slower visual cycles.
A value of 3 is useful when you prefer compact, fast-moving shapes. Increase the value when you want each shape to develop more gradually and remain visible for longer.
█ Settings
- Use Volume Weighting: Controls whether volume multiplies directional pressure before shape classification. Volume still controls the plotted column height when this setting is disabled.
- Detection Window: Sets the number of recent bars used to classify the current shape. Higher values produce slower and more stable classifications. Lower values react faster and may change shape more often.
- Polarity Smoothing: Sets the EMA length used to determine Bull or Bear polarity. Higher values create steadier polarity. Lower values react faster.
- Template Cycle Length: Sets the number of bars used to complete one synthetic shape template. Lower values create faster and tighter cycles. Higher values stretch the template over more bars.
- Show Moving Average: Shows or hides a moving average of the final plotted output.
- Type: Selects the moving-average method: SMA, EMA, RMA, or WMA.
- Length: Sets the moving-average period.
- Maximum Transparency: Sets the maximum transparency applied near the lower points of each template. A value of 0 disables the transparency fade.
-----------------
Disclaimer
The content provided in my scripts, indicators, ideas, algorithms, and systems is for educational and informational purposes only. It does not constitute financial advice, investment recommendations, or a solicitation to buy or sell any financial instruments. I will not accept liability for any loss or damage, including without limitation any loss of profit, which may arise directly or indirectly from the use of or reliance on such information.
All investments involve risk, and the past performance of a security, industry, sector, market, financial product, trading strategy, backtest, or individual's trading does not guarantee future results or returns. Investors are fully responsible for any investment decisions they make. Such decisions should be based solely on an evaluation of their financial circumstances, investment objectives, risk tolerance, and liquidity needs.
オープンソーススクリプト
TradingViewの精神に則り、このスクリプトの作者はコードをオープンソースとして公開してくれました。トレーダーが内容を確認・検証できるようにという配慮です。作者に拍手を送りましょう!無料で利用できますが、コードの再公開はハウスルールに従う必要があります。

Access my indicators at: zeiierman.com
Join Our Free Discord: discord.gg/zeiiermantrading
Join Our Free Discord: discord.gg/zeiiermantrading
免責事項
これらの情報および投稿は、TradingViewが提供または承認する金融、投資、取引、またはその他の種類の助言もしくは推奨であることを意図したものではなく、またこれらに該当するものでもありません。詳細は利用規約をご覧ください。
オープンソーススクリプト
TradingViewの精神に則り、このスクリプトの作者はコードをオープンソースとして公開してくれました。トレーダーが内容を確認・検証できるようにという配慮です。作者に拍手を送りましょう!無料で利用できますが、コードの再公開はハウスルールに従う必要があります。
Access my indicators at: zeiierman.com
Join Our Free Discord: discord.gg/zeiiermantrading
Join Our Free Discord: discord.gg/zeiiermantrading
免責事項
これらの情報および投稿は、TradingViewが提供または承認する金融、投資、取引、またはその他の種類の助言もしくは推奨であることを意図したものではなく、またこれらに該当するものでもありません。詳細は利用規約をご覧ください。