OPEN-SOURCE SCRIPT
Legkomolyabb skalp indikator
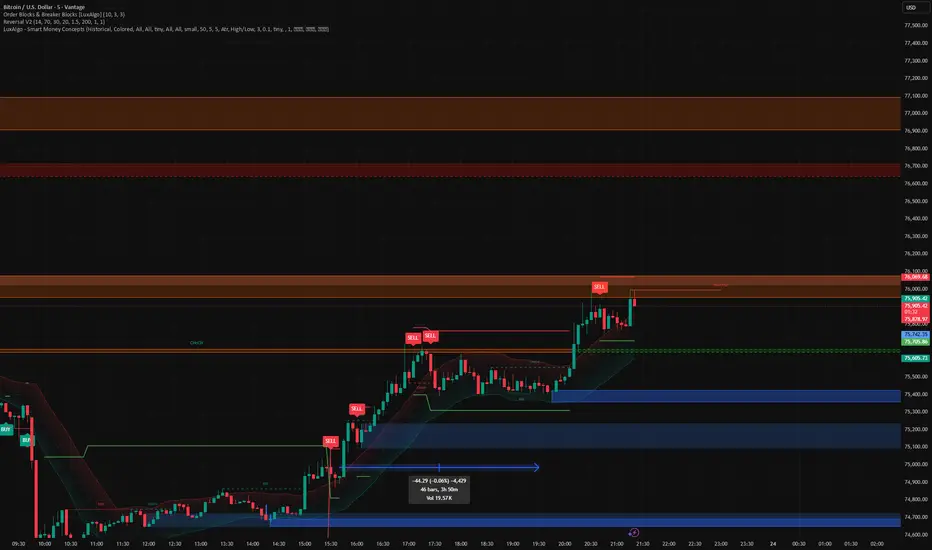
The main components of the script:
Triple Confirmation (Strategy)
Price exhaustion: The price moves outside ATR-based bands (overextended movement).
Momentum extreme: The RSI gives an overbought or oversold signal.
Structural reversal: A signal is only generated once a Pivot point (swing high or swing low) forms, confirming the reversal.
Trend Filter (EMA 200)
I integrated a 200 EMA. By default, you only receive:
Buy signals when the price is above the EMA (buying pullbacks in an uptrend),
Sell signals when the price is below the EMA.
This helps avoid losing trades against the main trend.
Risk Management (SL/TP)
The system automatically calculates the Stop-Loss level using ATR (volatility-based), giving the trade enough room to breathe.
The Take-Profit level is set automatically according to the selected risk/reward ratio (default: 1:2).
How to use it on the chart
Green triangles indicate buy opportunities.
Red triangles indicate sell opportunities.
The dashed/solid lines (red and green) show suggested exit levels after entry.
You can fine-tune the RSI levels or the trend filter anytime in the settings menu (gear icon).
Tip
If you use it on highly volatile markets (such as crypto), it’s recommended to increase the ATR multiplier (“Volatility Multiplier”) to 2.5 or 3.0 so the system only signals truly extreme exhaustion moves.
Triple Confirmation (Strategy)
Price exhaustion: The price moves outside ATR-based bands (overextended movement).
Momentum extreme: The RSI gives an overbought or oversold signal.
Structural reversal: A signal is only generated once a Pivot point (swing high or swing low) forms, confirming the reversal.
Trend Filter (EMA 200)
I integrated a 200 EMA. By default, you only receive:
Buy signals when the price is above the EMA (buying pullbacks in an uptrend),
Sell signals when the price is below the EMA.
This helps avoid losing trades against the main trend.
Risk Management (SL/TP)
The system automatically calculates the Stop-Loss level using ATR (volatility-based), giving the trade enough room to breathe.
The Take-Profit level is set automatically according to the selected risk/reward ratio (default: 1:2).
How to use it on the chart
Green triangles indicate buy opportunities.
Red triangles indicate sell opportunities.
The dashed/solid lines (red and green) show suggested exit levels after entry.
You can fine-tune the RSI levels or the trend filter anytime in the settings menu (gear icon).
Tip
If you use it on highly volatile markets (such as crypto), it’s recommended to increase the ATR multiplier (“Volatility Multiplier”) to 2.5 or 3.0 so the system only signals truly extreme exhaustion moves.
オープンソーススクリプト
TradingViewの精神に則り、このスクリプトの作者はコードをオープンソースとして公開してくれました。トレーダーが内容を確認・検証できるようにという配慮です。作者に拍手を送りましょう!無料で利用できますが、コードの再公開はハウスルールに従う必要があります。

免責事項
これらの情報および投稿は、TradingViewが提供または承認する金融、投資、取引、またはその他の種類の助言もしくは推奨であることを意図したものではなく、またこれらに該当するものでもありません。詳細は利用規約をご覧ください。
オープンソーススクリプト
TradingViewの精神に則り、このスクリプトの作者はコードをオープンソースとして公開してくれました。トレーダーが内容を確認・検証できるようにという配慮です。作者に拍手を送りましょう!無料で利用できますが、コードの再公開はハウスルールに従う必要があります。
免責事項
これらの情報および投稿は、TradingViewが提供または承認する金融、投資、取引、またはその他の種類の助言もしくは推奨であることを意図したものではなく、またこれらに該当するものでもありません。詳細は利用規約をご覧ください。