OPEN-SOURCE SCRIPT
Skippy the Indicator v1.8.4
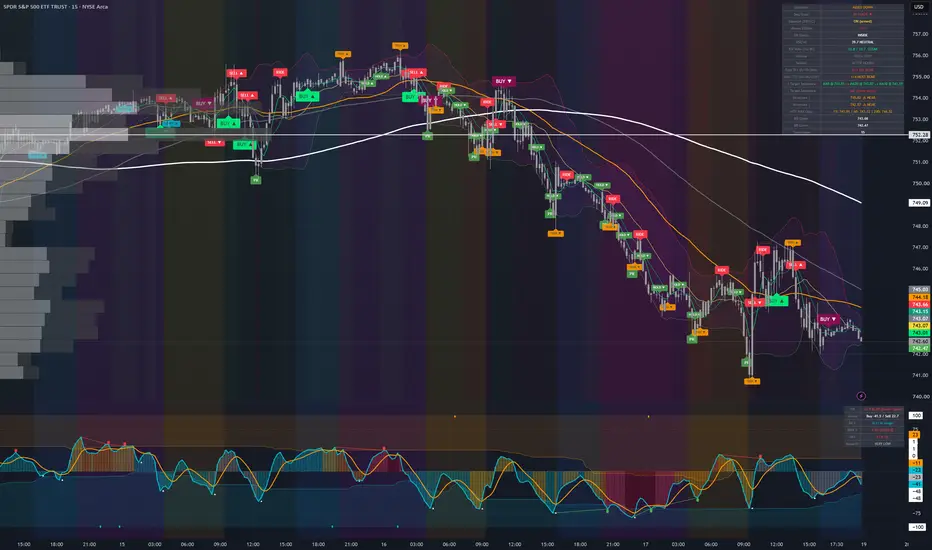
Multi-timeframe MA-structure framework for short-timeframe momentum trading. Codifies a full squeeze-to-exit sequence — squeeze arming, 50ma curl, MA-stack trigger, MA5 ride, staged exit — into plain-language labels, a state machine, and a dashboard.
THE SEQUENCE
The core logic walks one setup from start to finish:
WATCH → READY → BUY → HOLD → TRIM or SELL
WATCH — Squeeze armed. Bollinger Bands are inside the Keltner Channels; energy is compressing.
READY ▲/▼ — The 50ma has begun to curl in the trade direction. Early heads-up.
BUY ▲/▼ — Gamma trigger. MA5, MA10, and MA20 have all closed beyond the 50ma, with the required number of confirmation closes (user-set, default 1). A ★ on the BUY marks a full-sequence setup: squeeze → curl → cross.
HOLD ▲/▼ — Price retested the MA5 and held (the glue). Trend intact.
TRIM ▲/▼ — MA5 glue failed. The leg is done but the thesis is alive. Lighten and watch for re-entry. This is NOT an exit signal.
SELL ▲/▼ — Price rejected at the 50ma with confirmed closes. Thesis dead.
TRIM vs SELL is the one distinction not to blur: orange means the leg ended, red means the trade ended.
A Display toggle switches all labels to technical names (ARMED / CURL / GLUE ✓✗ / ✕50) if you prefer.
REVERSAL SIGNALS
PR — Potential Reversal at a Bollinger Band extreme, RSI-confirmed. As of v0.8.4, PR fires intrabar the moment the high/low touches the band — non-repainting, since a bar's high/low can only extend, never retract. A toggle restores close-confirmed firing. PR is a mean-reversion signal and misfires in strong trends by design — that is what HOLD and the Direction row are for.
RIDE logic converts a failed fade into a continuation read: PR fires, then MA5 holds on the retest — the fade failed and the prior trend is resuming.
DASHBOARD
Seq State in plain language (WAITING / WATCHING / GETTING READY / IN TRADE / LEG DONE — WATCH RE-ENTRY), Direction from full MA-stack alignment, RSI veto row, Fast TFs (5/15/30m) and Slow TFs (1h/4h/D/W) bullish counts, cascading three-level target sequence, structure proximity (previous highs/lows, necklines — wick-measured as of v0.8.4), session window, and volume (informational only — it never gates signals).
Display options: Full (19 rows) or Compact (9 rows), Tiny/Small/Normal text size, and position. On phones use Compact + Tiny + bottom right.
ALERTS
Every label has a matching alert, and push notifications lead with the action word ("BUY ▲ — MA5/10/20 closed above 50ma"). PR and structure alerts use touch semantics — set alert frequency to "Once per bar."
READING IT
Trigger and exit logic is close-confirmed on the chart timeframe: "through" a level means a confirmed close, not a wick. The state machine reads one chart — always check higher timeframes before acting. Fast/slow TF agreement is the conviction read; disagreement is information (fast bear + slow bull = pullback in an uptrend, fast bull + slow bear = bounce in a downtrend).
This is a study and visual-verification tool, not trade advice and not an executor. The label words are signal names, not instructions — nothing here is a recommendation to buy or sell anything. Judge the signals against what actually happens and size your own risk.
THE SEQUENCE
The core logic walks one setup from start to finish:
WATCH → READY → BUY → HOLD → TRIM or SELL
WATCH — Squeeze armed. Bollinger Bands are inside the Keltner Channels; energy is compressing.
READY ▲/▼ — The 50ma has begun to curl in the trade direction. Early heads-up.
BUY ▲/▼ — Gamma trigger. MA5, MA10, and MA20 have all closed beyond the 50ma, with the required number of confirmation closes (user-set, default 1). A ★ on the BUY marks a full-sequence setup: squeeze → curl → cross.
HOLD ▲/▼ — Price retested the MA5 and held (the glue). Trend intact.
TRIM ▲/▼ — MA5 glue failed. The leg is done but the thesis is alive. Lighten and watch for re-entry. This is NOT an exit signal.
SELL ▲/▼ — Price rejected at the 50ma with confirmed closes. Thesis dead.
TRIM vs SELL is the one distinction not to blur: orange means the leg ended, red means the trade ended.
A Display toggle switches all labels to technical names (ARMED / CURL / GLUE ✓✗ / ✕50) if you prefer.
REVERSAL SIGNALS
PR — Potential Reversal at a Bollinger Band extreme, RSI-confirmed. As of v0.8.4, PR fires intrabar the moment the high/low touches the band — non-repainting, since a bar's high/low can only extend, never retract. A toggle restores close-confirmed firing. PR is a mean-reversion signal and misfires in strong trends by design — that is what HOLD and the Direction row are for.
RIDE logic converts a failed fade into a continuation read: PR fires, then MA5 holds on the retest — the fade failed and the prior trend is resuming.
DASHBOARD
Seq State in plain language (WAITING / WATCHING / GETTING READY / IN TRADE / LEG DONE — WATCH RE-ENTRY), Direction from full MA-stack alignment, RSI veto row, Fast TFs (5/15/30m) and Slow TFs (1h/4h/D/W) bullish counts, cascading three-level target sequence, structure proximity (previous highs/lows, necklines — wick-measured as of v0.8.4), session window, and volume (informational only — it never gates signals).
Display options: Full (19 rows) or Compact (9 rows), Tiny/Small/Normal text size, and position. On phones use Compact + Tiny + bottom right.
ALERTS
Every label has a matching alert, and push notifications lead with the action word ("BUY ▲ — MA5/10/20 closed above 50ma"). PR and structure alerts use touch semantics — set alert frequency to "Once per bar."
READING IT
Trigger and exit logic is close-confirmed on the chart timeframe: "through" a level means a confirmed close, not a wick. The state machine reads one chart — always check higher timeframes before acting. Fast/slow TF agreement is the conviction read; disagreement is information (fast bear + slow bull = pullback in an uptrend, fast bull + slow bear = bounce in a downtrend).
This is a study and visual-verification tool, not trade advice and not an executor. The label words are signal names, not instructions — nothing here is a recommendation to buy or sell anything. Judge the signals against what actually happens and size your own risk.
オープンソーススクリプト
TradingViewの精神に則り、このスクリプトの作者はコードをオープンソースとして公開してくれました。トレーダーが内容を確認・検証できるようにという配慮です。作者に拍手を送りましょう!無料で利用できますが、コードの再公開はハウスルールに従う必要があります。

免責事項
これらの情報および投稿は、TradingViewが提供または承認する金融、投資、取引、またはその他の種類の助言もしくは推奨であることを意図したものではなく、またこれらに該当するものでもありません。詳細は利用規約をご覧ください。
オープンソーススクリプト
TradingViewの精神に則り、このスクリプトの作者はコードをオープンソースとして公開してくれました。トレーダーが内容を確認・検証できるようにという配慮です。作者に拍手を送りましょう!無料で利用できますが、コードの再公開はハウスルールに従う必要があります。
免責事項
これらの情報および投稿は、TradingViewが提供または承認する金融、投資、取引、またはその他の種類の助言もしくは推奨であることを意図したものではなく、またこれらに該当するものでもありません。詳細は利用規約をご覧ください。