VervoortCrossover Zero-Lag [NPR21]
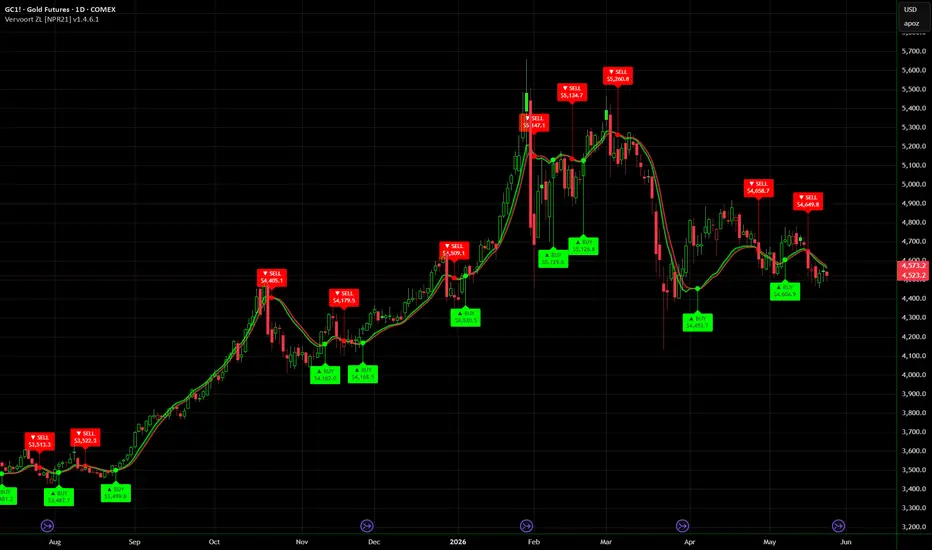
A Pine Script v6 conversion and enhancement of Sylvain Vervoort's published
zero-lag crossover indicator, originally written in ThinkScript and published
by Vervoort in Stocks & Commodities magazine in 2009. Full credit to Sylvain
Vervoort for the underlying mathematical concept.
WHAT IT DOES
The indicator plots two zero-lag TEMA lines and signals when they cross.
Both lines apply Vervoort's zero-lag transform to triple-smoothed EMAs of
two different price inputs:
Green line: zero-lag TEMA of Typical Price (HLC/3)
Red line: zero-lag TEMA of Vervoort's modified Heikin-Ashi close
The zero-lag transform is: ZL = TMA1 + (TMA1 - TMA2), where TMA2 is the
TEMA of TMA1. This is the same compensation method published by Vervoort,
which subtracts smoothing lag from the underlying TEMA without introducing
forward bias or repainting.
A BUY signal fires when the Typical-price line crosses above the
Heikin-Ashi line. A SELL signal fires on the inverse cross. Signals confirm
on bar close and do not repaint.
WHY TWO DIFFERENT INPUTS
The Heikin-Ashi line responds to body-direction shifts in the underlying
candles, while the Typical-price line tracks the volume-weighted center
of each bar's range. The crossover captures the moment where bar-by-bar
direction agreement and centered price flow diverge from one another -
which is Vervoort's stated rationale for the dual-input approach.
ENHANCEMENTS OVER THE ORIGINAL
This version is not a straight port. It adds:
- Three preset periods (Scalp 21, Vervoort 34, Swing 55) plus a custom
period input. 34 is Vervoort's published default.
- Configurable signal markers: triangle arrows, dot at cross, or dot
above/below bar.
- Optional BUY/SELL callout labels with ATR-based pushaway positioning
so labels stay clear of candles, with a connector line from the label
triangle tip back to the dot at the exact crossover price.
- Optional momentum fill between the two lines, tinted by which line
is leading.
- Configurable label sizes and colors with larger defaults suitable for
users with vision impairment.
- Built-in alert conditions for BUY, SELL, and any-signal events.
UNIVERSAL APPLICATION
The indicator is symbol-agnostic and works on any liquid market and any
timeframe. Default settings are tuned for intraday work; the Swing preset
or larger custom periods are appropriate for daily and weekly charts.
NON-REPAINTING
Signals are based on confirmed bar closes via ta.crossover and
ta.crossunder on the zero-lag values. There is no lookahead, no future
data referencing, and no forward-shifted plot offset. Historical signals
on the chart are exactly the signals that fired in real time.
HOW TO USE IT
STEP 1 - ADD TO CHART
Apply the indicator to any liquid instrument and timeframe. The two
zero-lag lines (green and red) will plot directly on price. The faint
shaded fill between them indicates which line is currently leading
(green tint when Typical leads, red tint when Heikin-Ashi leads).
STEP 2 - CHOOSE A PERIOD PRESET
Match the preset to the timeframe and trading style:
- Scalp (21): 1-5 minute charts, fast intraday turns
- Vervoort (34): 5-30 minute charts, balanced (Vervoort's default)
- Swing (55): 1-4 hour and daily charts, longer holds
- Custom: manual period for fine-tuning
STEP 3 - READ THE SIGNALS
A BUY fires when the green Typical-price line crosses above the red
Heikin-Ashi line. A SELL fires on the inverse cross. The dot marks
the exact crossover price on the green line. The label provides the
formatted price and direction.
STEP 4 - CONFIRM BEFORE ACTING
The crossover is a directional trigger, not a complete trading system.
Best results come from confirming the signal against:
- Higher-timeframe trend (do not fade against the dominant trend)
- Support and resistance levels visible on the chart
- Volume confirmation on the signal bar
- Your own risk management (stop placement, position sizing)
STEP 5 - MANAGE THE EXIT
This indicator signals entries. Exits should be governed by your own
rules - a fixed risk-reward ratio, a trailing stop, a structural level,
or the opposite-direction crossover. The indicator does not generate
exit signals on its own.
STEP 6 - SET ALERTS
Three alert conditions are exposed:
- Vervoort ZL - Buy Signal
- Vervoort ZL - Sell Signal
- Vervoort ZL - Any Signal
Right-click the indicator name, select "Add alert on Vervoort ZL,"
and choose the condition. The default message includes ticker and
timeframe.
BEST PRACTICES
- Avoid using the Scalp preset on illiquid or low-volume instruments;
noise will generate frequent false crossovers.
- On daily and weekly charts, the Swing preset reduces whipsaw but
gives later entries - this is the expected trade-off.
- In strong directional trends, expect counter-trend crossovers to
fail more often than they succeed. The crossover does not measure
trend strength on its own.
- The dot-at-cross marker matches the original ThinkScript appearance
and is the cleanest visual for chart-heavy users.
SETTINGS WORTH TUNING
Period Preset: lower for faster signals on shorter timeframes
Marker Style: Dot at Cross matches the original ThinkScript look
Show BUY / SELL Callout Labels: turn off if you prefer a cleaner chart
Label Pushaway (ATR x): raise for more space between labels and candles
Momentum Fill: toggle off if you find it visually busy
CREDIT
Original concept and ThinkScript implementation: Sylvain Vervoort,
Stocks & Commodities magazine, 2009. This Pine Script v6 conversion and
the listed enhancements are by NPR21.
zero-lag crossover indicator, originally written in ThinkScript and published
by Vervoort in Stocks & Commodities magazine in 2009. Full credit to Sylvain
Vervoort for the underlying mathematical concept.
WHAT IT DOES
The indicator plots two zero-lag TEMA lines and signals when they cross.
Both lines apply Vervoort's zero-lag transform to triple-smoothed EMAs of
two different price inputs:
Green line: zero-lag TEMA of Typical Price (HLC/3)
Red line: zero-lag TEMA of Vervoort's modified Heikin-Ashi close
The zero-lag transform is: ZL = TMA1 + (TMA1 - TMA2), where TMA2 is the
TEMA of TMA1. This is the same compensation method published by Vervoort,
which subtracts smoothing lag from the underlying TEMA without introducing
forward bias or repainting.
A BUY signal fires when the Typical-price line crosses above the
Heikin-Ashi line. A SELL signal fires on the inverse cross. Signals confirm
on bar close and do not repaint.
WHY TWO DIFFERENT INPUTS
The Heikin-Ashi line responds to body-direction shifts in the underlying
candles, while the Typical-price line tracks the volume-weighted center
of each bar's range. The crossover captures the moment where bar-by-bar
direction agreement and centered price flow diverge from one another -
which is Vervoort's stated rationale for the dual-input approach.
ENHANCEMENTS OVER THE ORIGINAL
This version is not a straight port. It adds:
- Three preset periods (Scalp 21, Vervoort 34, Swing 55) plus a custom
period input. 34 is Vervoort's published default.
- Configurable signal markers: triangle arrows, dot at cross, or dot
above/below bar.
- Optional BUY/SELL callout labels with ATR-based pushaway positioning
so labels stay clear of candles, with a connector line from the label
triangle tip back to the dot at the exact crossover price.
- Optional momentum fill between the two lines, tinted by which line
is leading.
- Configurable label sizes and colors with larger defaults suitable for
users with vision impairment.
- Built-in alert conditions for BUY, SELL, and any-signal events.
UNIVERSAL APPLICATION
The indicator is symbol-agnostic and works on any liquid market and any
timeframe. Default settings are tuned for intraday work; the Swing preset
or larger custom periods are appropriate for daily and weekly charts.
NON-REPAINTING
Signals are based on confirmed bar closes via ta.crossover and
ta.crossunder on the zero-lag values. There is no lookahead, no future
data referencing, and no forward-shifted plot offset. Historical signals
on the chart are exactly the signals that fired in real time.
HOW TO USE IT
STEP 1 - ADD TO CHART
Apply the indicator to any liquid instrument and timeframe. The two
zero-lag lines (green and red) will plot directly on price. The faint
shaded fill between them indicates which line is currently leading
(green tint when Typical leads, red tint when Heikin-Ashi leads).
STEP 2 - CHOOSE A PERIOD PRESET
Match the preset to the timeframe and trading style:
- Scalp (21): 1-5 minute charts, fast intraday turns
- Vervoort (34): 5-30 minute charts, balanced (Vervoort's default)
- Swing (55): 1-4 hour and daily charts, longer holds
- Custom: manual period for fine-tuning
STEP 3 - READ THE SIGNALS
A BUY fires when the green Typical-price line crosses above the red
Heikin-Ashi line. A SELL fires on the inverse cross. The dot marks
the exact crossover price on the green line. The label provides the
formatted price and direction.
STEP 4 - CONFIRM BEFORE ACTING
The crossover is a directional trigger, not a complete trading system.
Best results come from confirming the signal against:
- Higher-timeframe trend (do not fade against the dominant trend)
- Support and resistance levels visible on the chart
- Volume confirmation on the signal bar
- Your own risk management (stop placement, position sizing)
STEP 5 - MANAGE THE EXIT
This indicator signals entries. Exits should be governed by your own
rules - a fixed risk-reward ratio, a trailing stop, a structural level,
or the opposite-direction crossover. The indicator does not generate
exit signals on its own.
STEP 6 - SET ALERTS
Three alert conditions are exposed:
- Vervoort ZL - Buy Signal
- Vervoort ZL - Sell Signal
- Vervoort ZL - Any Signal
Right-click the indicator name, select "Add alert on Vervoort ZL,"
and choose the condition. The default message includes ticker and
timeframe.
BEST PRACTICES
- Avoid using the Scalp preset on illiquid or low-volume instruments;
noise will generate frequent false crossovers.
- On daily and weekly charts, the Swing preset reduces whipsaw but
gives later entries - this is the expected trade-off.
- In strong directional trends, expect counter-trend crossovers to
fail more often than they succeed. The crossover does not measure
trend strength on its own.
- The dot-at-cross marker matches the original ThinkScript appearance
and is the cleanest visual for chart-heavy users.
SETTINGS WORTH TUNING
Period Preset: lower for faster signals on shorter timeframes
Marker Style: Dot at Cross matches the original ThinkScript look
Show BUY / SELL Callout Labels: turn off if you prefer a cleaner chart
Label Pushaway (ATR x): raise for more space between labels and candles
Momentum Fill: toggle off if you find it visually busy
CREDIT
Original concept and ThinkScript implementation: Sylvain Vervoort,
Stocks & Commodities magazine, 2009. This Pine Script v6 conversion and
the listed enhancements are by NPR21.

NPR21 Premium Indicators | Access all tiers at whop.com/npr21 | DM me on TradingView for questions
免責事項
これらの情報および投稿は、TradingViewが提供または承認する金融、投資、取引、またはその他の種類の助言もしくは推奨であることを意図したものではなく、またこれらに該当するものでもありません。詳細は利用規約をご覧ください。
NPR21 Premium Indicators | Access all tiers at whop.com/npr21 | DM me on TradingView for questions
免責事項
これらの情報および投稿は、TradingViewが提供または承認する金融、投資、取引、またはその他の種類の助言もしくは推奨であることを意図したものではなく、またこれらに該当するものでもありません。詳細は利用規約をご覧ください。