Daily Fixed Volume Profile [DAVIES T]
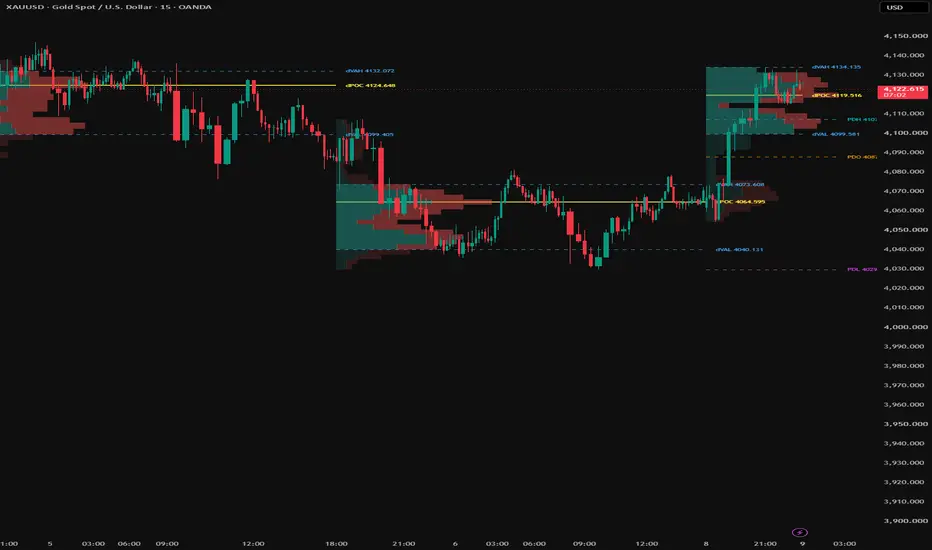
Daily Fixed Volume Profile [DAVIES T]
OVERVIEW
A fixed-range volume profile drawn for every trading day, plus the developing profile for today. Each day gets its own histogram, Point of Control (POC) and Value Area (VAH / VAL), so you can see where volume built up day by day and which levels price is still respecting. Yesterday's Open, High and Low (PDO / PDH / PDL) are plotted alongside, using the same day definition as the profiles.
HOW IT WORKS
- Each candle's volume is spread across every price row its high-low range covers, in proportion to the overlap, rather than being placed at the close. This gives a more accurate shape on lower timeframes.
- Volume is split into up-candle and down-candle volume, so each row shows who was in control at that price.
- The Value Area is built outward from the POC, adding the heavier neighbouring row each step until the chosen percentage (default 70%) is reached.
- Rows outside the Value Area are faded so the core of the day stands out.
FEATURES
- Daily profiles for the last 1-20 completed days, plus the live developing day
- POC line, dashed VAH / VAL lines and price labels (dPOC / dVAH / dVAL)
- Up / down volume split (can be switched to a single colour)
- Naked POCs: each completed day's POC extends right until price trades through it, then is removed
- Previous Day Open (PDO), Previous Day High (PDH) and Previous Day Low (PDL) lines with labels
- Optional day range box
- Profiles can hang from the day's open (Left) or from the day's close (Right)
DAY START OPTIONS
- Exchange: uses the chart's own daily candle (00:00 UTC on most crypto exchanges)
- NY 00:00: ICT midnight-to-midnight New York day
- NY 18:00: futures / forex trading day
The NY modes work on 24/7 crypto as well as markets with weekend gaps. PDO / PDH / PDL always follow the selected Day Start.
ALERTS
- Naked daily POC touched
- PDH taken (first break of the previous day high each day)
- PDL taken (first break of the previous day low each day)
SETTINGS TIPS
- Best used on 1m to 15m charts.
- On 1H there are only 24 candles per profile, so lower Rows to around 20 for a cleaner shape.
- Rows are capped automatically so all profiles fit within TradingView's drawing limits; showing more days gives fewer rows per profile.
NOTES
Volume distribution is estimated from candle ranges on the chart timeframe, not from tick data, so the profile will differ slightly from TradingView's built-in tick-based volume profiles. This script is a visual analysis tool and does not give buy or sell signals. Not financial advice.
OVERVIEW
A fixed-range volume profile drawn for every trading day, plus the developing profile for today. Each day gets its own histogram, Point of Control (POC) and Value Area (VAH / VAL), so you can see where volume built up day by day and which levels price is still respecting. Yesterday's Open, High and Low (PDO / PDH / PDL) are plotted alongside, using the same day definition as the profiles.
HOW IT WORKS
- Each candle's volume is spread across every price row its high-low range covers, in proportion to the overlap, rather than being placed at the close. This gives a more accurate shape on lower timeframes.
- Volume is split into up-candle and down-candle volume, so each row shows who was in control at that price.
- The Value Area is built outward from the POC, adding the heavier neighbouring row each step until the chosen percentage (default 70%) is reached.
- Rows outside the Value Area are faded so the core of the day stands out.
FEATURES
- Daily profiles for the last 1-20 completed days, plus the live developing day
- POC line, dashed VAH / VAL lines and price labels (dPOC / dVAH / dVAL)
- Up / down volume split (can be switched to a single colour)
- Naked POCs: each completed day's POC extends right until price trades through it, then is removed
- Previous Day Open (PDO), Previous Day High (PDH) and Previous Day Low (PDL) lines with labels
- Optional day range box
- Profiles can hang from the day's open (Left) or from the day's close (Right)
DAY START OPTIONS
- Exchange: uses the chart's own daily candle (00:00 UTC on most crypto exchanges)
- NY 00:00: ICT midnight-to-midnight New York day
- NY 18:00: futures / forex trading day
The NY modes work on 24/7 crypto as well as markets with weekend gaps. PDO / PDH / PDL always follow the selected Day Start.
ALERTS
- Naked daily POC touched
- PDH taken (first break of the previous day high each day)
- PDL taken (first break of the previous day low each day)
SETTINGS TIPS
- Best used on 1m to 15m charts.
- On 1H there are only 24 candles per profile, so lower Rows to around 20 for a cleaner shape.
- Rows are capped automatically so all profiles fit within TradingView's drawing limits; showing more days gives fewer rows per profile.
NOTES
Volume distribution is estimated from candle ranges on the chart timeframe, not from tick data, so the profile will differ slightly from TradingView's built-in tick-based volume profiles. This script is a visual analysis tool and does not give buy or sell signals. Not financial advice.

免責事項
これらの情報および投稿は、TradingViewが提供または承認する金融、投資、取引、またはその他の種類の助言もしくは推奨であることを意図したものではなく、またこれらに該当するものでもありません。詳細は利用規約をご覧ください。
免責事項
これらの情報および投稿は、TradingViewが提供または承認する金融、投資、取引、またはその他の種類の助言もしくは推奨であることを意図したものではなく、またこれらに該当するものでもありません。詳細は利用規約をご覧ください。