OPEN-SOURCE SCRIPT
Projected High/Low [Market Breakers]
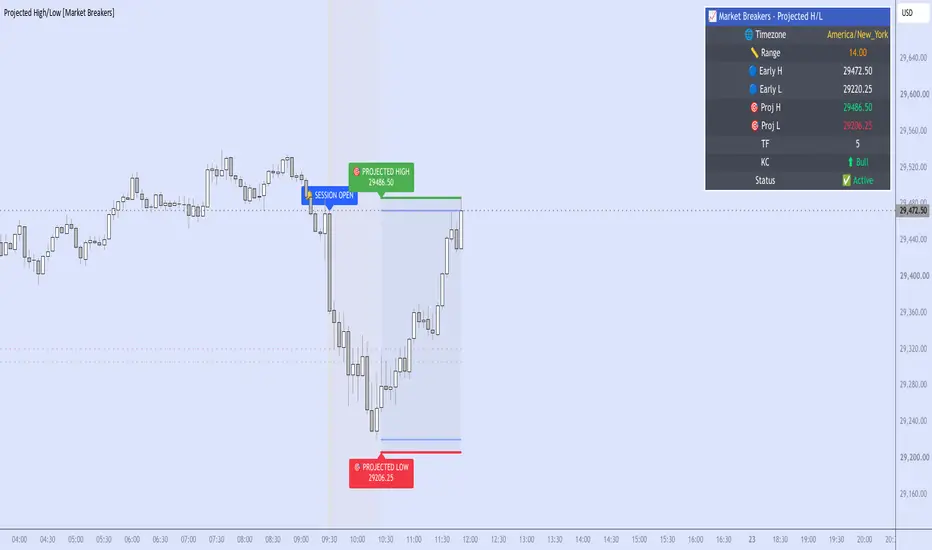
Market Breakers — Projected High/Low
An intraday range-projection tool that anticipates where the day's high and low are likely to form. It sizes the expected daily range using a set of classic envelope formulas, measures where price establishes itself early in the RTH session, then projects target levels outward from those early extremes.
Credit
The envelope and range-projection math at the core of this script is adapted from formulas taught by George Angell in his older instructional videos. Full credit for the underlying concepts goes to his original work — this indicator simply ports that math into Pine Script and wraps it in session handling, a validity filter, and visualization. This is an open-source release so anyone can read, learn from, and build on the approach.
The Idea
Angell's method estimates a market's anticipated range for the session from recent price behavior, rather than reacting to price after it moves. This indicator takes that estimate and answers a practical question: if the market is going to travel its expected range, and it has already carved out these early highs and lows, where does that put the day's likely extremes?
So instead of drawing a static range, it anchors the projection to real, current-session structure.
How It Works
1. Anticipated Range — the envelope engine
At the start of each trading day the script builds two envelopes from the prior session's price action:
Sell Envelope — the average of four values: the session high, a trend-reaction pivot (2 × HLC3 − Low), a "buying high" push (High + 3-bar avg of High − prior High), and an anticipated rally (Low + 3-bar avg of High − prior Low).
Buy Envelope — the mirror: the session low, a trend-reaction pivot (2 × HLC3 − High), an anticipated decline, and an anticipated buy-under level.
The distance between the two envelopes is the Anticipated Range — the day's expected travel.
2. Early-session extremes
After the RTH open (default 09:30 exchange time), the script records the high and low of an early period (default: first 60 minutes). These become the anchors for the projection.
3. Projection
Once the early period completes:
Projected High = Early High + Anticipated Range
Projected Low = Early Low − Anticipated Range
Both levels plot as lines with labels, and the space between them is lightly shaded.
Validity filter
Projections only print if the early-period range is at least 20% of the Anticipated Range. A dead, rangeless open won't produce meaningful anchors, so the tool stays quiet rather than projecting off noise.
Session & Timezone Handling
The trading day rolls over at 18:00 (6 PM) exchange time to match the CME futures session, and the reference timezone is fully selectable (defaults to America/New_York). All session logic — day tracking, RTH open, early period — respects the chosen timezone.
Keltner Context Filter
An EMA basis with ATR-based bands provides a quick directional read. It's used as a bias readout (Bull / Bear in the summary table), not as a hard entry signal — context, not a trigger.
Features
Timezone-aware session and day tracking (18:00 futures rollover)
Prior-day envelope calculation for the Anticipated Range
Early-period high/low capture with a range-validity gate
Projected High / Low lines, labels, and shaded projection zone
Optional Keltner channels + Bull/Bear bias
On-chart summary table (range, early H/L, projections, TF, status)
Independent size and color controls for every label type
Alert fired when projections are set for the day
Settings Overview
Session Timing — exchange timezone, RTH session window, early-period length
Keltner Filter — length, multiplier, show/hide
Label Sizes — per-label size (projected high, projected low, range, session open)
Label Settings — offsets, price-on-label toggle, which labels to show
Label Colors — full color control per label
Visuals — line colors, envelope plot, Keltner color
Table — position and text size
How to Use
1.)Add it to an intraday chart of an index future — NQ / MNQ / ES / MES are the natural fit — on
a timeframe where the early period spans several bars (e.g. 1–15 min).
2.)Confirm the timezone matches your session; the default is New York.
3.)Let the early period complete. If the open had enough range, the projected high and low
print and the table shows ✅ Active.
4.)Treat the projected levels as anticipated areas of interest — potential targets, exhaustion
zones, or places to watch for reaction — not guaranteed turning points.
5.)Use the Keltner bias for directional context when deciding which side of the projection to
lean on.
Notes
Built and tuned around index-futures session timing; it runs on any market, but the 18:00 rollover and RTH window assume a futures-style session.
Projections are estimates derived from prior-session behavior. Markets don't owe you their range — use these as a framework, not a promise.
Open-source: the full logic is in the code. Read it, adapt it, and make it your own.
This tool is for educational and informational purposes only and is not financial advice.
An intraday range-projection tool that anticipates where the day's high and low are likely to form. It sizes the expected daily range using a set of classic envelope formulas, measures where price establishes itself early in the RTH session, then projects target levels outward from those early extremes.
Credit
The envelope and range-projection math at the core of this script is adapted from formulas taught by George Angell in his older instructional videos. Full credit for the underlying concepts goes to his original work — this indicator simply ports that math into Pine Script and wraps it in session handling, a validity filter, and visualization. This is an open-source release so anyone can read, learn from, and build on the approach.
The Idea
Angell's method estimates a market's anticipated range for the session from recent price behavior, rather than reacting to price after it moves. This indicator takes that estimate and answers a practical question: if the market is going to travel its expected range, and it has already carved out these early highs and lows, where does that put the day's likely extremes?
So instead of drawing a static range, it anchors the projection to real, current-session structure.
How It Works
1. Anticipated Range — the envelope engine
At the start of each trading day the script builds two envelopes from the prior session's price action:
Sell Envelope — the average of four values: the session high, a trend-reaction pivot (2 × HLC3 − Low), a "buying high" push (High + 3-bar avg of High − prior High), and an anticipated rally (Low + 3-bar avg of High − prior Low).
Buy Envelope — the mirror: the session low, a trend-reaction pivot (2 × HLC3 − High), an anticipated decline, and an anticipated buy-under level.
The distance between the two envelopes is the Anticipated Range — the day's expected travel.
2. Early-session extremes
After the RTH open (default 09:30 exchange time), the script records the high and low of an early period (default: first 60 minutes). These become the anchors for the projection.
3. Projection
Once the early period completes:
Projected High = Early High + Anticipated Range
Projected Low = Early Low − Anticipated Range
Both levels plot as lines with labels, and the space between them is lightly shaded.
Validity filter
Projections only print if the early-period range is at least 20% of the Anticipated Range. A dead, rangeless open won't produce meaningful anchors, so the tool stays quiet rather than projecting off noise.
Session & Timezone Handling
The trading day rolls over at 18:00 (6 PM) exchange time to match the CME futures session, and the reference timezone is fully selectable (defaults to America/New_York). All session logic — day tracking, RTH open, early period — respects the chosen timezone.
Keltner Context Filter
An EMA basis with ATR-based bands provides a quick directional read. It's used as a bias readout (Bull / Bear in the summary table), not as a hard entry signal — context, not a trigger.
Features
Timezone-aware session and day tracking (18:00 futures rollover)
Prior-day envelope calculation for the Anticipated Range
Early-period high/low capture with a range-validity gate
Projected High / Low lines, labels, and shaded projection zone
Optional Keltner channels + Bull/Bear bias
On-chart summary table (range, early H/L, projections, TF, status)
Independent size and color controls for every label type
Alert fired when projections are set for the day
Settings Overview
Session Timing — exchange timezone, RTH session window, early-period length
Keltner Filter — length, multiplier, show/hide
Label Sizes — per-label size (projected high, projected low, range, session open)
Label Settings — offsets, price-on-label toggle, which labels to show
Label Colors — full color control per label
Visuals — line colors, envelope plot, Keltner color
Table — position and text size
How to Use
1.)Add it to an intraday chart of an index future — NQ / MNQ / ES / MES are the natural fit — on
a timeframe where the early period spans several bars (e.g. 1–15 min).
2.)Confirm the timezone matches your session; the default is New York.
3.)Let the early period complete. If the open had enough range, the projected high and low
print and the table shows ✅ Active.
4.)Treat the projected levels as anticipated areas of interest — potential targets, exhaustion
zones, or places to watch for reaction — not guaranteed turning points.
5.)Use the Keltner bias for directional context when deciding which side of the projection to
lean on.
Notes
Built and tuned around index-futures session timing; it runs on any market, but the 18:00 rollover and RTH window assume a futures-style session.
Projections are estimates derived from prior-session behavior. Markets don't owe you their range — use these as a framework, not a promise.
Open-source: the full logic is in the code. Read it, adapt it, and make it your own.
This tool is for educational and informational purposes only and is not financial advice.
オープンソーススクリプト
TradingViewの精神に則り、このスクリプトの作者はコードをオープンソースとして公開してくれました。トレーダーが内容を確認・検証できるようにという配慮です。作者に拍手を送りましょう!無料で利用できますが、コードの再公開はハウスルールに従う必要があります。

免責事項
これらの情報および投稿は、TradingViewが提供または承認する金融、投資、取引、またはその他の種類の助言もしくは推奨であることを意図したものではなく、またこれらに該当するものでもありません。詳細は利用規約をご覧ください。
オープンソーススクリプト
TradingViewの精神に則り、このスクリプトの作者はコードをオープンソースとして公開してくれました。トレーダーが内容を確認・検証できるようにという配慮です。作者に拍手を送りましょう!無料で利用できますが、コードの再公開はハウスルールに従う必要があります。
免責事項
これらの情報および投稿は、TradingViewが提供または承認する金融、投資、取引、またはその他の種類の助言もしくは推奨であることを意図したものではなく、またこれらに該当するものでもありません。詳細は利用規約をご覧ください。