OPEN-SOURCE SCRIPT
更新済 Average Price / Time
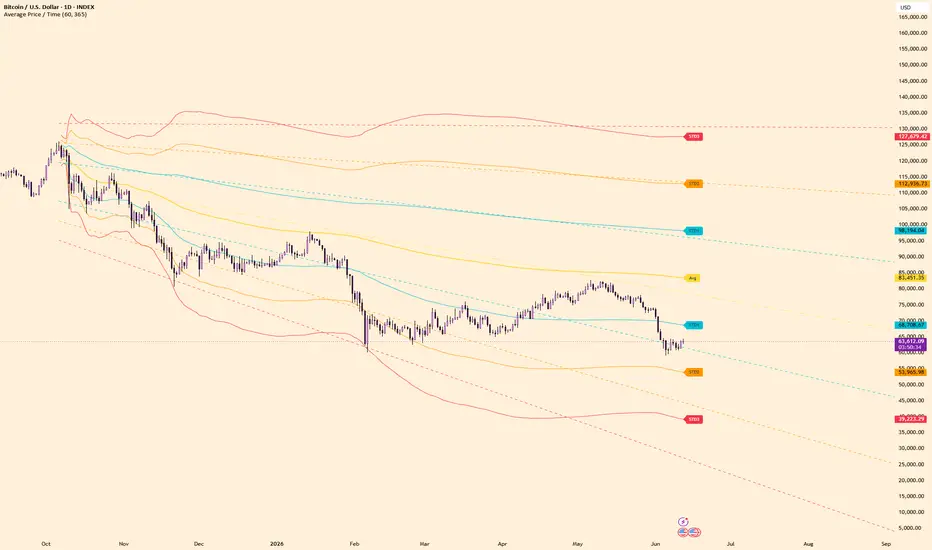
Average Price / Time calculates an anchored time-at-price average from a selected starting candle.
The script uses 1-hour candle ranges by default and treats time as evenly distributed across each candle’s high-low range. From the selected anchor point, it calculates the average price and plots standard deviation bands around it.
Features:
- Mouse-selected start candle
- Time-at-price average
- STD1, STD2, and STD3 bands
- Current z-score shown in the data window
Note:
This is a time-at-price approximation, not a volume-weighted calculation. It measures where price spent time, not where the most volume traded.
The script uses 1-hour candle ranges by default and treats time as evenly distributed across each candle’s high-low range. From the selected anchor point, it calculates the average price and plots standard deviation bands around it.
Features:
- Mouse-selected start candle
- Time-at-price average
- STD1, STD2, and STD3 bands
- Current z-score shown in the data window
Note:
This is a time-at-price approximation, not a volume-weighted calculation. It measures where price spent time, not where the most volume traded.
リリースノート
Added linear-regression projection tools for Avg and standard deviation levels.The indicator now calculates regression slopes for Avg, STD1, STD2, and STD3 levels from the anchored period and draws forward projection lines based on those fitted trends.
Projection length is user configurable, and projected slopes are available in the data window.
オープンソーススクリプト
TradingViewの精神に則り、このスクリプトの作者はコードをオープンソースとして公開してくれました。トレーダーが内容を確認・検証できるようにという配慮です。作者に拍手を送りましょう!無料で利用できますが、コードの再公開はハウスルールに従う必要があります。

免責事項
これらの情報および投稿は、TradingViewが提供または承認する金融、投資、取引、またはその他の種類の助言もしくは推奨であることを意図したものではなく、またこれらに該当するものでもありません。詳細は利用規約をご覧ください。
オープンソーススクリプト
TradingViewの精神に則り、このスクリプトの作者はコードをオープンソースとして公開してくれました。トレーダーが内容を確認・検証できるようにという配慮です。作者に拍手を送りましょう!無料で利用できますが、コードの再公開はハウスルールに従う必要があります。
免責事項
これらの情報および投稿は、TradingViewが提供または承認する金融、投資、取引、またはその他の種類の助言もしくは推奨であることを意図したものではなく、またこれらに該当するものでもありません。詳細は利用規約をご覧ください。