OPEN-SOURCE SCRIPT
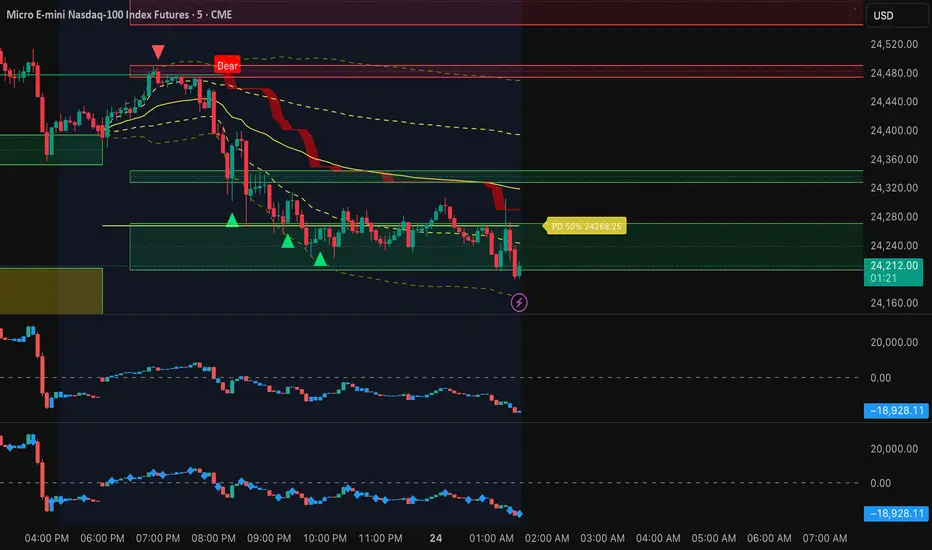
CVD Candles.
█ WHAT IS CVD?
Cumulative Volume Delta (CVD) tracks the running total of buying volume minus selling volume. It reveals who's in control — buyers or sellers — beyond what price alone shows.
█ HOW IT WORKS
Each candle represents the cumulative delta:
• Delta = Buy Volume − Sell Volume
• CVD = Running sum of delta
This creates a "price chart" of order flow, making it easy to spot divergences between price and actual buying/selling pressure.
█ 3-COLOR SYSTEM
🟢 GREEN — Strong Bullish
Price closed above previous bar's high. Buyers in control.
🔴 RED — Strong Bearish
Price closed below previous bar's low. Sellers in control.
🔵 BLUE — Neutral (Reversal Signal)
Price closed between previous high/low. Momentum pausing — watch for potential reversal.
█ HOW TO USE
1. TREND CONFIRMATION
Price up + CVD up (green) = Strong trend ✓
Price up + CVD down (red) = Weak trend, possible reversal
2. DIVERGENCE
Price making new highs but CVD declining = Bearish divergence
Price making new lows but CVD rising = Bullish divergence
3. REVERSAL SIGNALS
Blue candles indicate momentum pause — often precede reversals
█ SETTINGS
• Reset Daily: Resets CVD at each session start
• Works best on futures, stocks, and crypto with volume data
█ CREDITS
Inspired by Bookmap's Cumulative Delta indicator.
Cumulative Volume Delta (CVD) tracks the running total of buying volume minus selling volume. It reveals who's in control — buyers or sellers — beyond what price alone shows.
█ HOW IT WORKS
Each candle represents the cumulative delta:
• Delta = Buy Volume − Sell Volume
• CVD = Running sum of delta
This creates a "price chart" of order flow, making it easy to spot divergences between price and actual buying/selling pressure.
█ 3-COLOR SYSTEM
🟢 GREEN — Strong Bullish
Price closed above previous bar's high. Buyers in control.
🔴 RED — Strong Bearish
Price closed below previous bar's low. Sellers in control.
🔵 BLUE — Neutral (Reversal Signal)
Price closed between previous high/low. Momentum pausing — watch for potential reversal.
█ HOW TO USE
1. TREND CONFIRMATION
Price up + CVD up (green) = Strong trend ✓
Price up + CVD down (red) = Weak trend, possible reversal
2. DIVERGENCE
Price making new highs but CVD declining = Bearish divergence
Price making new lows but CVD rising = Bullish divergence
3. REVERSAL SIGNALS
Blue candles indicate momentum pause — often precede reversals
█ SETTINGS
• Reset Daily: Resets CVD at each session start
• Works best on futures, stocks, and crypto with volume data
█ CREDITS
Inspired by Bookmap's Cumulative Delta indicator.
オープンソーススクリプト
TradingViewの精神に則り、このスクリプトの作者はコードをオープンソースとして公開してくれました。トレーダーが内容を確認・検証できるようにという配慮です。作者に拍手を送りましょう!無料で利用できますが、コードの再公開はハウスルールに従う必要があります。

免責事項
これらの情報および投稿は、TradingViewが提供または承認する金融、投資、取引、またはその他の種類の助言もしくは推奨であることを意図したものではなく、またこれらに該当するものでもありません。詳細は利用規約をご覧ください。
オープンソーススクリプト
TradingViewの精神に則り、このスクリプトの作者はコードをオープンソースとして公開してくれました。トレーダーが内容を確認・検証できるようにという配慮です。作者に拍手を送りましょう!無料で利用できますが、コードの再公開はハウスルールに従う必要があります。
免責事項
これらの情報および投稿は、TradingViewが提供または承認する金融、投資、取引、またはその他の種類の助言もしくは推奨であることを意図したものではなく、またこれらに該当するものでもありません。詳細は利用規約をご覧ください。