Volume Heat Map by Green Squad
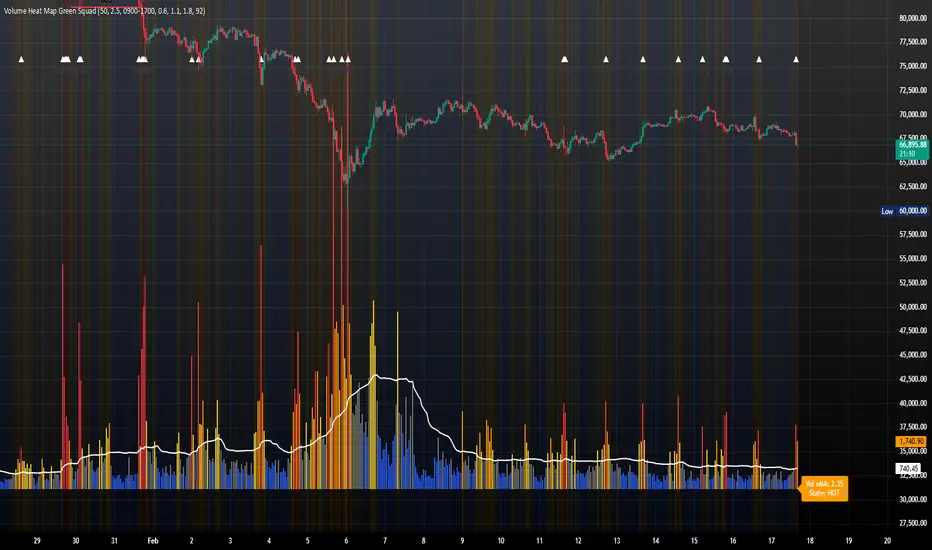
The Volume Heat Map measures relative participation intensity by normalizing current volume against its moving average.
Instead of displaying raw volume, the indicator evaluates how active the market is relative to its recent baseline, allowing volume to adapt across timeframes, instruments, and changing volatility regimes.
Core Logic
At its foundation:
Relative Volume = Volume / SMA(Volume, Length)
1.0 → Above-average participation
< 1.0 → Below-average participation
This relative ratio is classified into participation regimes:
Cold → Weak activity
Normal → Baseline conditions
Warm → Expanding interest
Hot → Strong engagement
Very Hot → Aggressive order flow
This transforms volume from a raw histogram into a structured participation state model.
Bullish vs Bearish Classification
Relative volume is paired with candle direction:
Green spectrum → Bullish participation expansion
Red spectrum → Bearish participation expansion
This allows instant assessment of:
Who is initiating pressure
Whether momentum is supported by liquidity
Whether a move is commitment-driven or thin
The indicator does not measure delta, but it approximates initiative bias through price acceptance within the bar.
Volume-Weighted Breakouts
Breakouts are only highlighted when:
Price exceeds a defined structural range
Relative volume exceeds a minimum threshold
This filters low-liquidity fakeouts and emphasizes breakouts supported by real participation.
The logic reflects a fundamental auction principle:
Structural expansion requires participation to sustain.
Practical Application
This indicator is diagnostic, not predictive. It is best used to:
Confirm breakout strength
Validate continuation setups
Filter weak signals
Detect early participation expansion before volatility expansion
Volume expansion often precedes structural shifts.
This tool isolates that transition in real time.
Stay tuner for more trading tools.
Instead of displaying raw volume, the indicator evaluates how active the market is relative to its recent baseline, allowing volume to adapt across timeframes, instruments, and changing volatility regimes.
Core Logic
At its foundation:
Relative Volume = Volume / SMA(Volume, Length)
1.0 → Above-average participation
< 1.0 → Below-average participation
This relative ratio is classified into participation regimes:
Cold → Weak activity
Normal → Baseline conditions
Warm → Expanding interest
Hot → Strong engagement
Very Hot → Aggressive order flow
This transforms volume from a raw histogram into a structured participation state model.
Bullish vs Bearish Classification
Relative volume is paired with candle direction:
Green spectrum → Bullish participation expansion
Red spectrum → Bearish participation expansion
This allows instant assessment of:
Who is initiating pressure
Whether momentum is supported by liquidity
Whether a move is commitment-driven or thin
The indicator does not measure delta, but it approximates initiative bias through price acceptance within the bar.
Volume-Weighted Breakouts
Breakouts are only highlighted when:
Price exceeds a defined structural range
Relative volume exceeds a minimum threshold
This filters low-liquidity fakeouts and emphasizes breakouts supported by real participation.
The logic reflects a fundamental auction principle:
Structural expansion requires participation to sustain.
Practical Application
This indicator is diagnostic, not predictive. It is best used to:
Confirm breakout strength
Validate continuation setups
Filter weak signals
Detect early participation expansion before volatility expansion
Volume expansion often precedes structural shifts.
This tool isolates that transition in real time.
Stay tuner for more trading tools.

免責事項
これらの情報および投稿は、TradingViewが提供または承認する金融、投資、取引、またはその他の種類の助言もしくは推奨であることを意図したものではなく、またこれらに該当するものでもありません。詳細は利用規約をご覧ください。
免責事項
これらの情報および投稿は、TradingViewが提供または承認する金融、投資、取引、またはその他の種類の助言もしくは推奨であることを意図したものではなく、またこれらに該当するものでもありません。詳細は利用規約をご覧ください。