アップデート済
Weis Wave, Close-Extreme
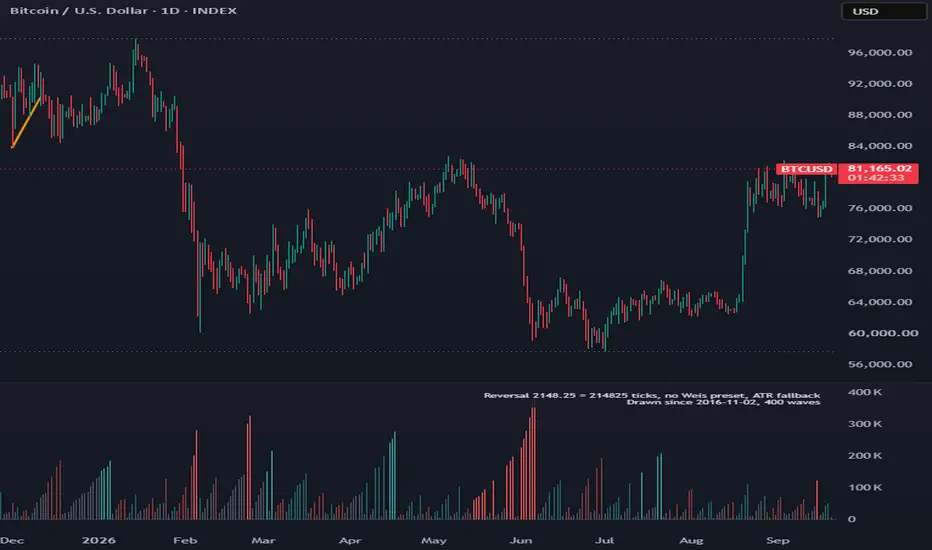
Weis Wave Volume, Close-Extreme
█ OVERVIEW
This indicator plots cumulative wave volume in a separate pane, using the wave construction rules that David Weis gives in chapters 9 and 10 of his book "Trades About to Happen". The script divides price into alternating up-waves and down-waves from bar closes, and it assigns the volume of each bar to the wave that the bar belongs to. The thesis is that volume totaled over a price wave shows the effort behind a move more clearly than volume totaled over equal periods of time.
The script can also draw the wave line and turning-point labels on the price chart, flag shortening of thrust, compare each wave with earlier waves in the same direction, and send alerts. These options are off by default, except the wave reversal alert.
█ HISTORY / BACKGROUND
Richard Wyckoff recorded intraday trading on a tape reading chart. This chart was a point and figure grid with the volume of each price change written in the squares. Wyckoff also kept a wave chart of leading stocks. The wave chart divided each session into buying waves and selling waves, and Wyckoff compared the length, duration and volume of these waves to find changes in trend.
David Weis applied the wave chart to single instruments. His book "Trades About to Happen" (2013) describes the development. Weis changed the tape reading chart into a continuous line. He then filtered the line with a minimum reversal, in the same way that a point and figure chart with a reversal larger than its box size removes small reactions. Because it is not practical to record each trade in a modern market, Weis builds the waves from the closing prices of time bars or tick bars. He totals the volume on each wave and plots the totals as a histogram below the price movement.
The conceptual basis is that price moves in waves of unequal duration. Volume divided into equal time periods hides the force of the buying and the selling. Volume totaled per wave lets the reader compare effort (volume) with reward (price progress) and with duration from one wave to the next.
█ HOW IT WORKS
Reversal size
On each bar the script calculates a candidate reversal size from the selected Mode:
• Auto (Weis table) reads `syminfo.root` and `syminfo.type` and selects a fixed price amount that Weis published for intraday study: ES and MES 0.75, NQ and MNQ 2.0, YM and MYM 5.0, RTY and M2K 0.40, ZB 3/32, ZN and ZF 0.015625, GC and MGC 5.0, SI and SIL 0.05, HG 0.0025, ZS, ZC and ZW 1.0, SB and CT 0.10, CC 2.0, KC 0.25, the currency futures 6E, 6B, 6A, 6C, 6S, 6N and M6E 0.0003, forex symbols 3 pips, and stocks, funds and depositary receipts 0.10. The script multiplies the preset by Preset multiplier. If no preset applies to the symbol, the mode uses the ATR calculation.
• Ticks multiplies the input by `syminfo.mintick`.
• Price uses the input as a price amount.
• Percent uses a percentage of the current close.
• ATR (frozen) multiplies an ATR value by one of two multipliers. On intraday charts the ATR is the daily ATR of the previous completed day, which the script gets through `request.security()` with a one-bar offset and lookahead. This value is constant during the session. On daily and higher charts the ATR is the ATR of the previous bar on the chart timeframe.
The script rounds the candidate to a whole number of ticks, with a minimum of one tick. The script stores the reversal size when a wave starts and does not change it until the next wave starts.
Wave state machine
All changes of state occur only when `barstate.isconfirmed` is true.
1. The first bar that has a valid reversal size becomes the anchor. The anchor close is the reference price. The direction is undetermined.
2. While the direction is undetermined, the first close that is the reversal amount or more above the anchor starts an up-wave. The first close that is the reversal amount or more below the anchor starts a down-wave.
3. In an up-wave, a close that is equal to or higher than the extreme close of the wave continues the wave. That close becomes the new extreme. In a down-wave, a close that is equal to or lower than the extreme close continues the wave.
4. A close that is the reversal amount or more from the extreme close, against the wave, ends the wave. The ended wave stops at its extreme bar. The new wave starts at that extreme and runs to the current bar. The comparison uses "greater than or equal" with a tolerance of 1% of a tick for floating-point error.
5. A bar that does not continue the wave and does not reverse it is an untotaled bar. The script adds its volume to a pending total.
Volume attribution
When a bar continues the wave, the script adds the pending total and the volume of that bar to the wave, and sets the pending total to zero. When a bar reverses the wave, the pending total and the volume of that bar become the first volume of the new wave. Thus the volume of the bars after the extreme bar belongs to the new wave, as in the worksheet procedure in the book.
Volume source
The script uses the `volume` of the chart. If the symbol supplies no volume and Use true range instead of volume is "Auto", the script uses true range as the measure of activity. "Always" uses true range on all symbols.
Wave analytics
The script keeps each wave in an array of a user-defined type with direction, start and end bar, start and end price, start and end time, volume, highest high and lowest low.
• Rank. The script compares the volume of a wave with the prior N waves of the same direction. If the volume is larger than all N, the wave is ranked high. When the wave is complete and its volume is smaller than all N, the wave is ranked low. No rank is given until N prior waves exist.
• Shortening of thrust. When a wave is complete, the script examines it and the two prior waves of the same direction. For up-waves, the flag is set when the three highest highs rise and the last increase is smaller than the increase before it. For down-waves, the same test applies to the lowest lows. The high and low of a wave include the bars after its extreme close, up to the bar that reverses it.
█ HOW TO USE
Read the height of the last column of a wave, or the height of its box, as the total effort on that wave. Compare that total with the price progress and the duration of the wave, and with the earlier waves in the same direction. Weis reads conditions such as these: large volume with small progress, small volume on a pullback, and decreasing length and volume on successive waves in a trend.
Visual elements
• Running columns (default). On each bar that continues or starts a wave, a column shows the cumulative volume of that wave in the up or down color. On an untotaled bar, a gray column shows the pending total. The last colored column of a sequence is the total for the wave. A column is drawn solid when the wave is ranked high.
• Wave boxes. One box per wave extends from the extreme bar of the prior wave to the extreme bar of this wave. The height of the box is the volume of the wave. A solid box is a wave ranked high, and a faint box is a wave ranked low. A gray box shows the pending total until the subsequent closes resolve it.
• Wave line. A line on the price chart connects the extreme closes of successive waves.
• Labels. A label at each turning point gives the wave volume. Optionally it gives the length in ticks, the duration in bars, and the text "SOT" for shortening of thrust. The tooltip of the label gives volume, length, duration in bars and minutes, volume per tick, and rank.
• Zero line and scale plot. A horizontal line marks zero. In Wave boxes mode an invisible plot sets the vertical scale of the pane, because drawing objects do not set the scale.
• Status table. The table shows the active reversal size in price and in ticks, the source of the reversal size, the number of waves started in the current day on intraday charts, a note when true range is in use, and the start date and count of the waves held in memory.
Timeframe
The logic operates on the closes of any chart timeframe. The preset table contains the amounts that Weis published for intraday study, and his examples use closes of one to five minutes, so the Auto mode is designed for intraday charts of one to five minutes. On a daily or higher chart, select ATR (frozen), Percent or Price, because a preset for intraday study causes a reversal on almost every daily bar for most symbols. For each symbol and timeframe, adjust the reversal size until the number of waves is neither too large nor too small to read. On intraday charts the status table gives the count for the current day.
█ SETTINGS
Reversal size
• Mode: the method that sets the reversal size. Default: Auto (Weis table).
• Preset multiplier: a multiplier for the Auto preset. The presets date from approximately 2011, when most of these markets traded at lower prices. Default: 1.0.
• Ticks: the reversal in ticks for the Ticks mode. Default: 3.
• Price: the reversal as a price amount for the Price mode. Default: 0.75.
• Percent of price: the reversal as a percentage of the close for the Percent mode. Default: 0.05.
• ATR length: the period of the ATR. Default: 14.
• ATR multiplier, intraday: the multiplier for the prior daily ATR on intraday charts. Default: 0.05.
• ATR multiplier, daily and higher: the multiplier for the ATR of the previous bar on daily and higher charts. Default: 1.0.
Volume
• Use true range instead of volume: Auto, Always or Never. Default: Auto.
• Auto format volume (K, M): formats volume text with K, M and B suffixes. Default: on.
• Volume divisor when auto format is off: divides volume in text output. Default: 1000.
Display
• Histogram: Running columns or Wave boxes. Default: Running columns.
• Volume text inside boxes: writes the wave volume in each box. Default: off.
• Wave line on price chart: draws the wave line on the main chart. Default: off.
• Wave line width: Default: 1.
• Labels at turning points: draws the volume labels on the main chart. Default: off.
• Label: wave length in ticks: Default: off.
• Label: wave duration in bars: Default: off.
• Label size: Tiny, Small or Normal. Default: Small.
• Up wave, Down wave, Untotaled volume: the colors for up-waves, down-waves and pending volume. Defaults: teal, red and gray.
• Status table: shows the table in the top right corner of the pane. Default: on.
• Waves kept: the number of waves held in memory and drawn. Range: 20 to 500. Default: 400.
• Pane scale cap, multiple of median wave volume: for Wave boxes only. Limits the vertical scale of the pane to this multiple of the median volume of the last 30 completed waves. A box above the limit extends beyond the top of the pane. The value 0 disables the limit. Default: 3.0.
Analytics and alerts
• Compare against prior N same-direction waves: the N for the rank. Default: 3.
• Flag shortening of thrust: adds "SOT" to the label of a flagged wave. Default: on.
• Alert: wave reversal: calls `alert()` when a wave reverses. The message gives the volume, length and duration of the completed wave. Default: on.
• Alert: largest volume in N waves: Default: off.
• Alert: shortening of thrust: Default: off.
The script also supplies four `alertcondition()` items: wave turned up, wave turned down, largest volume in N waves, and shortening of thrust. The `alert()` calls use the once-per-bar-close frequency, and all alert events are set only on confirmed bars.
█ WHAT MAKES IT ORIGINAL
Public wave volume scripts commonly find the wave direction by one of two methods: a comparison of successive closes through a trend length, or the level of a Renko brick. These scripts add volume to the current wave until the bar that confirms the change of direction. This script uses a different method in four respects.
1. Reference price. The reversal is measured from the extreme close of the current wave. A brick-level reference moves only in steps of the brick size, so the effective reversal varies between one and two times the setting. The extreme-close reference keeps the effective reversal equal to the setting.
2. Continuation and reversal tests. A close equal to the extreme continues the wave, and a move equal to the reversal amount reverses the wave. Both tests agree with the procedure that Weis describes ("a reversal of 3/32nds or more").
3. Volume attribution. The volume of the bars between the extreme bar and the confirming bar goes to the new wave. The wave boundary is the extreme bar. In the Wave boxes display, the script draws each wave as a box that it can move and resize, so this attribution is exact for completed waves.
4. Constant reversal within a wave. The reversal size is rounded to whole ticks and is stored when a wave starts. The ATR option uses the ATR of the previous completed day, so the threshold does not change during a session or during a wave.
The script also measures shortening of thrust on bar highs and lows, as the book specifies, and not on the closing turning points of the waves.
█ NOTES / LIMITATIONS
• Repainting. The state of the waves changes only on confirmed bars, and completed waves do not change. The current wave is provisional by nature: its extreme and its volume increase until a reversal is confirmed, and a reversal is known only one or more bars after the extreme. In Running columns mode, the open realtime bar shows a provisional column that can change until the bar closes. In Wave boxes mode, the open bar is not drawn until it closes.
• Higher-timeframe request. On intraday charts, the ATR calculation requests the daily timeframe with lookahead and a one-bar offset. This supplies the ATR of the previous completed day and does not use future data. No output occurs until that value exists, so a symbol needs more daily bars of history than the ATR length. The other modes do not have this requirement.
• Running columns attribution. A plotted column cannot be changed after its bar closes. On untotaled bars, the gray columns show the pending total. The total for each wave is correct at its last colored column.
• Object limits. The platform permits 500 lines, 500 labels and 500 boxes per script. The script holds a maximum of 500 waves (Waves kept), and removes the oldest wave and its drawings above that number. Thus the Wave boxes display, the wave line and the labels cover only the most recent waves. If the reversal size is small, this can be a short period. Running columns have no such limit and extend through the full chart history. Rank and shortening of thrust use only the waves held in memory.
• Timeframe sensitivity. The Auto presets are fixed price amounts for intraday study from approximately 2011. The script applies them on all timeframes. At present prices they can be too small, and on daily and higher charts they are usually too small. Use Preset multiplier or a different mode. The default ATR multipliers are starting values of the author and are not from the book.
• Symbol class. Presets exist only for the futures roots in the list above, for forex symbols, and for stocks, funds and depositary receipts. All other symbols, including crypto, energy and cash indices, use the ATR calculation in Auto mode. The pip calculation for forex assumes that a quote with an odd number of decimals has a fractional pip digit.
• Volume data. The output depends on the volume that the data feed supplies. Forex and CFD volume is usually tick volume. The volume of a cash index can be a composite of its constituents with large values on the first and last bars of the session, and these values dominate the waves that include those bars. If a symbol has no volume and the true range setting is "Never", all columns are zero.
• Sessions. A wave continues through session boundaries and gaps, as in the book. A gap larger than the reversal size reverses the wave on the first close after the gap.
• Percent mode. The reversal size is calculated from the close on the bar that starts each wave and stays constant for that wave, so successive waves can have different sizes.
• Scope. The script is a tool for the analysis of price and volume. It does not give buy or sell signals.
█ OVERVIEW
This indicator plots cumulative wave volume in a separate pane, using the wave construction rules that David Weis gives in chapters 9 and 10 of his book "Trades About to Happen". The script divides price into alternating up-waves and down-waves from bar closes, and it assigns the volume of each bar to the wave that the bar belongs to. The thesis is that volume totaled over a price wave shows the effort behind a move more clearly than volume totaled over equal periods of time.
The script can also draw the wave line and turning-point labels on the price chart, flag shortening of thrust, compare each wave with earlier waves in the same direction, and send alerts. These options are off by default, except the wave reversal alert.
█ HISTORY / BACKGROUND
Richard Wyckoff recorded intraday trading on a tape reading chart. This chart was a point and figure grid with the volume of each price change written in the squares. Wyckoff also kept a wave chart of leading stocks. The wave chart divided each session into buying waves and selling waves, and Wyckoff compared the length, duration and volume of these waves to find changes in trend.
David Weis applied the wave chart to single instruments. His book "Trades About to Happen" (2013) describes the development. Weis changed the tape reading chart into a continuous line. He then filtered the line with a minimum reversal, in the same way that a point and figure chart with a reversal larger than its box size removes small reactions. Because it is not practical to record each trade in a modern market, Weis builds the waves from the closing prices of time bars or tick bars. He totals the volume on each wave and plots the totals as a histogram below the price movement.
The conceptual basis is that price moves in waves of unequal duration. Volume divided into equal time periods hides the force of the buying and the selling. Volume totaled per wave lets the reader compare effort (volume) with reward (price progress) and with duration from one wave to the next.
█ HOW IT WORKS
Reversal size
On each bar the script calculates a candidate reversal size from the selected Mode:
• Auto (Weis table) reads `syminfo.root` and `syminfo.type` and selects a fixed price amount that Weis published for intraday study: ES and MES 0.75, NQ and MNQ 2.0, YM and MYM 5.0, RTY and M2K 0.40, ZB 3/32, ZN and ZF 0.015625, GC and MGC 5.0, SI and SIL 0.05, HG 0.0025, ZS, ZC and ZW 1.0, SB and CT 0.10, CC 2.0, KC 0.25, the currency futures 6E, 6B, 6A, 6C, 6S, 6N and M6E 0.0003, forex symbols 3 pips, and stocks, funds and depositary receipts 0.10. The script multiplies the preset by Preset multiplier. If no preset applies to the symbol, the mode uses the ATR calculation.
• Ticks multiplies the input by `syminfo.mintick`.
• Price uses the input as a price amount.
• Percent uses a percentage of the current close.
• ATR (frozen) multiplies an ATR value by one of two multipliers. On intraday charts the ATR is the daily ATR of the previous completed day, which the script gets through `request.security()` with a one-bar offset and lookahead. This value is constant during the session. On daily and higher charts the ATR is the ATR of the previous bar on the chart timeframe.
The script rounds the candidate to a whole number of ticks, with a minimum of one tick. The script stores the reversal size when a wave starts and does not change it until the next wave starts.
Wave state machine
All changes of state occur only when `barstate.isconfirmed` is true.
1. The first bar that has a valid reversal size becomes the anchor. The anchor close is the reference price. The direction is undetermined.
2. While the direction is undetermined, the first close that is the reversal amount or more above the anchor starts an up-wave. The first close that is the reversal amount or more below the anchor starts a down-wave.
3. In an up-wave, a close that is equal to or higher than the extreme close of the wave continues the wave. That close becomes the new extreme. In a down-wave, a close that is equal to or lower than the extreme close continues the wave.
4. A close that is the reversal amount or more from the extreme close, against the wave, ends the wave. The ended wave stops at its extreme bar. The new wave starts at that extreme and runs to the current bar. The comparison uses "greater than or equal" with a tolerance of 1% of a tick for floating-point error.
5. A bar that does not continue the wave and does not reverse it is an untotaled bar. The script adds its volume to a pending total.
Volume attribution
When a bar continues the wave, the script adds the pending total and the volume of that bar to the wave, and sets the pending total to zero. When a bar reverses the wave, the pending total and the volume of that bar become the first volume of the new wave. Thus the volume of the bars after the extreme bar belongs to the new wave, as in the worksheet procedure in the book.
Volume source
The script uses the `volume` of the chart. If the symbol supplies no volume and Use true range instead of volume is "Auto", the script uses true range as the measure of activity. "Always" uses true range on all symbols.
Wave analytics
The script keeps each wave in an array of a user-defined type with direction, start and end bar, start and end price, start and end time, volume, highest high and lowest low.
• Rank. The script compares the volume of a wave with the prior N waves of the same direction. If the volume is larger than all N, the wave is ranked high. When the wave is complete and its volume is smaller than all N, the wave is ranked low. No rank is given until N prior waves exist.
• Shortening of thrust. When a wave is complete, the script examines it and the two prior waves of the same direction. For up-waves, the flag is set when the three highest highs rise and the last increase is smaller than the increase before it. For down-waves, the same test applies to the lowest lows. The high and low of a wave include the bars after its extreme close, up to the bar that reverses it.
█ HOW TO USE
Read the height of the last column of a wave, or the height of its box, as the total effort on that wave. Compare that total with the price progress and the duration of the wave, and with the earlier waves in the same direction. Weis reads conditions such as these: large volume with small progress, small volume on a pullback, and decreasing length and volume on successive waves in a trend.
Visual elements
• Running columns (default). On each bar that continues or starts a wave, a column shows the cumulative volume of that wave in the up or down color. On an untotaled bar, a gray column shows the pending total. The last colored column of a sequence is the total for the wave. A column is drawn solid when the wave is ranked high.
• Wave boxes. One box per wave extends from the extreme bar of the prior wave to the extreme bar of this wave. The height of the box is the volume of the wave. A solid box is a wave ranked high, and a faint box is a wave ranked low. A gray box shows the pending total until the subsequent closes resolve it.
• Wave line. A line on the price chart connects the extreme closes of successive waves.
• Labels. A label at each turning point gives the wave volume. Optionally it gives the length in ticks, the duration in bars, and the text "SOT" for shortening of thrust. The tooltip of the label gives volume, length, duration in bars and minutes, volume per tick, and rank.
• Zero line and scale plot. A horizontal line marks zero. In Wave boxes mode an invisible plot sets the vertical scale of the pane, because drawing objects do not set the scale.
• Status table. The table shows the active reversal size in price and in ticks, the source of the reversal size, the number of waves started in the current day on intraday charts, a note when true range is in use, and the start date and count of the waves held in memory.
Timeframe
The logic operates on the closes of any chart timeframe. The preset table contains the amounts that Weis published for intraday study, and his examples use closes of one to five minutes, so the Auto mode is designed for intraday charts of one to five minutes. On a daily or higher chart, select ATR (frozen), Percent or Price, because a preset for intraday study causes a reversal on almost every daily bar for most symbols. For each symbol and timeframe, adjust the reversal size until the number of waves is neither too large nor too small to read. On intraday charts the status table gives the count for the current day.
█ SETTINGS
Reversal size
• Mode: the method that sets the reversal size. Default: Auto (Weis table).
• Preset multiplier: a multiplier for the Auto preset. The presets date from approximately 2011, when most of these markets traded at lower prices. Default: 1.0.
• Ticks: the reversal in ticks for the Ticks mode. Default: 3.
• Price: the reversal as a price amount for the Price mode. Default: 0.75.
• Percent of price: the reversal as a percentage of the close for the Percent mode. Default: 0.05.
• ATR length: the period of the ATR. Default: 14.
• ATR multiplier, intraday: the multiplier for the prior daily ATR on intraday charts. Default: 0.05.
• ATR multiplier, daily and higher: the multiplier for the ATR of the previous bar on daily and higher charts. Default: 1.0.
Volume
• Use true range instead of volume: Auto, Always or Never. Default: Auto.
• Auto format volume (K, M): formats volume text with K, M and B suffixes. Default: on.
• Volume divisor when auto format is off: divides volume in text output. Default: 1000.
Display
• Histogram: Running columns or Wave boxes. Default: Running columns.
• Volume text inside boxes: writes the wave volume in each box. Default: off.
• Wave line on price chart: draws the wave line on the main chart. Default: off.
• Wave line width: Default: 1.
• Labels at turning points: draws the volume labels on the main chart. Default: off.
• Label: wave length in ticks: Default: off.
• Label: wave duration in bars: Default: off.
• Label size: Tiny, Small or Normal. Default: Small.
• Up wave, Down wave, Untotaled volume: the colors for up-waves, down-waves and pending volume. Defaults: teal, red and gray.
• Status table: shows the table in the top right corner of the pane. Default: on.
• Waves kept: the number of waves held in memory and drawn. Range: 20 to 500. Default: 400.
• Pane scale cap, multiple of median wave volume: for Wave boxes only. Limits the vertical scale of the pane to this multiple of the median volume of the last 30 completed waves. A box above the limit extends beyond the top of the pane. The value 0 disables the limit. Default: 3.0.
Analytics and alerts
• Compare against prior N same-direction waves: the N for the rank. Default: 3.
• Flag shortening of thrust: adds "SOT" to the label of a flagged wave. Default: on.
• Alert: wave reversal: calls `alert()` when a wave reverses. The message gives the volume, length and duration of the completed wave. Default: on.
• Alert: largest volume in N waves: Default: off.
• Alert: shortening of thrust: Default: off.
The script also supplies four `alertcondition()` items: wave turned up, wave turned down, largest volume in N waves, and shortening of thrust. The `alert()` calls use the once-per-bar-close frequency, and all alert events are set only on confirmed bars.
█ WHAT MAKES IT ORIGINAL
Public wave volume scripts commonly find the wave direction by one of two methods: a comparison of successive closes through a trend length, or the level of a Renko brick. These scripts add volume to the current wave until the bar that confirms the change of direction. This script uses a different method in four respects.
1. Reference price. The reversal is measured from the extreme close of the current wave. A brick-level reference moves only in steps of the brick size, so the effective reversal varies between one and two times the setting. The extreme-close reference keeps the effective reversal equal to the setting.
2. Continuation and reversal tests. A close equal to the extreme continues the wave, and a move equal to the reversal amount reverses the wave. Both tests agree with the procedure that Weis describes ("a reversal of 3/32nds or more").
3. Volume attribution. The volume of the bars between the extreme bar and the confirming bar goes to the new wave. The wave boundary is the extreme bar. In the Wave boxes display, the script draws each wave as a box that it can move and resize, so this attribution is exact for completed waves.
4. Constant reversal within a wave. The reversal size is rounded to whole ticks and is stored when a wave starts. The ATR option uses the ATR of the previous completed day, so the threshold does not change during a session or during a wave.
The script also measures shortening of thrust on bar highs and lows, as the book specifies, and not on the closing turning points of the waves.
█ NOTES / LIMITATIONS
• Repainting. The state of the waves changes only on confirmed bars, and completed waves do not change. The current wave is provisional by nature: its extreme and its volume increase until a reversal is confirmed, and a reversal is known only one or more bars after the extreme. In Running columns mode, the open realtime bar shows a provisional column that can change until the bar closes. In Wave boxes mode, the open bar is not drawn until it closes.
• Higher-timeframe request. On intraday charts, the ATR calculation requests the daily timeframe with lookahead and a one-bar offset. This supplies the ATR of the previous completed day and does not use future data. No output occurs until that value exists, so a symbol needs more daily bars of history than the ATR length. The other modes do not have this requirement.
• Running columns attribution. A plotted column cannot be changed after its bar closes. On untotaled bars, the gray columns show the pending total. The total for each wave is correct at its last colored column.
• Object limits. The platform permits 500 lines, 500 labels and 500 boxes per script. The script holds a maximum of 500 waves (Waves kept), and removes the oldest wave and its drawings above that number. Thus the Wave boxes display, the wave line and the labels cover only the most recent waves. If the reversal size is small, this can be a short period. Running columns have no such limit and extend through the full chart history. Rank and shortening of thrust use only the waves held in memory.
• Timeframe sensitivity. The Auto presets are fixed price amounts for intraday study from approximately 2011. The script applies them on all timeframes. At present prices they can be too small, and on daily and higher charts they are usually too small. Use Preset multiplier or a different mode. The default ATR multipliers are starting values of the author and are not from the book.
• Symbol class. Presets exist only for the futures roots in the list above, for forex symbols, and for stocks, funds and depositary receipts. All other symbols, including crypto, energy and cash indices, use the ATR calculation in Auto mode. The pip calculation for forex assumes that a quote with an odd number of decimals has a fractional pip digit.
• Volume data. The output depends on the volume that the data feed supplies. Forex and CFD volume is usually tick volume. The volume of a cash index can be a composite of its constituents with large values on the first and last bars of the session, and these values dominate the waves that include those bars. If a symbol has no volume and the true range setting is "Never", all columns are zero.
• Sessions. A wave continues through session boundaries and gaps, as in the book. A gap larger than the reversal size reverses the wave on the first close after the gap.
• Percent mode. The reversal size is calculated from the close on the bar that starts each wave and stays constant for that wave, so successive waves can have different sizes.
• Scope. The script is a tool for the analysis of price and volume. It does not give buy or sell signals.
リリースノート
Updated defaultsリリースノート
Changes in this version:• New reversal mode, Calibrated, now the default. It sets the reversal as a multiple of the frozen ATR so that waves last Target bars per wave on average (default 3.0), measured on the chart's own history with the same wave rules. The target has the same meaning on every symbol and timeframe.
• New flag for large effort with small result (E>R). A completed wave is flagged when its volume is larger than each of the prior N same-direction waves and its length in ticks is no larger than their median. It appears in labels, as a thick box border in Wave boxes mode, as an optional alert and as a fifth alertcondition.
• With Use true range instead of volume set to Auto, the script now switches from true range to volume once, at the first bar with volume. Before, it tested each bar, so a feed with scattered missing volume mixed the two in one chart.
• The maximum of Waves kept is now 499, so the wave boxes and the untotaled box stay within the 500-box limit. At 500, the oldest kept box was removed one wave early.
• The label tooltip gives duration in calendar days on daily and higher charts.
• The status table shows the average bars per wave over the last 50 waves, the calibrated ATR multiple, and the date volume starts when a feed has no volume on its earliest bars.
リリースノート
Changes in this version:New reversal mode, Calibrated, now the default. It sets the reversal as a multiple of the frozen ATR so that waves last Target bars per wave on average, measured on the chart's own history with the same wave rules. The target has the same meaning on every symbol and timeframe. The default target is 3.0, and Calibration length, bars sets the averaging window, default 250. Calibrated replaces the description's advice to select ATR (frozen), Percent or Price on daily and higher charts.
New flag for large effort with small result (E>R). A completed wave is flagged when its volume and its volume per tick of progress are both larger than those of each of the prior N same-direction waves and its length in ticks is shorter than the longest of them. It appears in labels, as a thick box border in Wave boxes mode, as an optional alert and as a fifth alertcondition.
Auto (Weis table) now matches futures roots only on futures symbols. Before, a stock or fund whose ticker equals a futures root, such as ES or SIL, received the futures preset instead of 0.10.
With Use true range instead of volume set to Auto, the script now switches from true range to volume once, at the first bar with volume. Before, it tested each bar, so a feed with scattered missing volume mixed the two in one chart.
The maximum of Waves kept is now 499, so the wave boxes and the untotaled box stay within the 500-box limit. At 500, the oldest kept box was removed one wave early.
The label tooltip gives duration in calendar days on daily and higher charts.
The status table shows the average bars per wave over the last 50 waves, the calibrated ATR multiple, and the date volume starts when a feed has no volume on its earliest bars.

免責事項
これらの情報および投稿は、TradingViewが提供または承認する金融、投資、取引、またはその他の種類の助言もしくは推奨であることを意図したものではなく、またこれらに該当するものでもありません。詳細は利用規約をご覧ください。
免責事項
これらの情報および投稿は、TradingViewが提供または承認する金融、投資、取引、またはその他の種類の助言もしくは推奨であることを意図したものではなく、またこれらに該当するものでもありません。詳細は利用規約をご覧ください。