OPEN-SOURCE SCRIPT
options
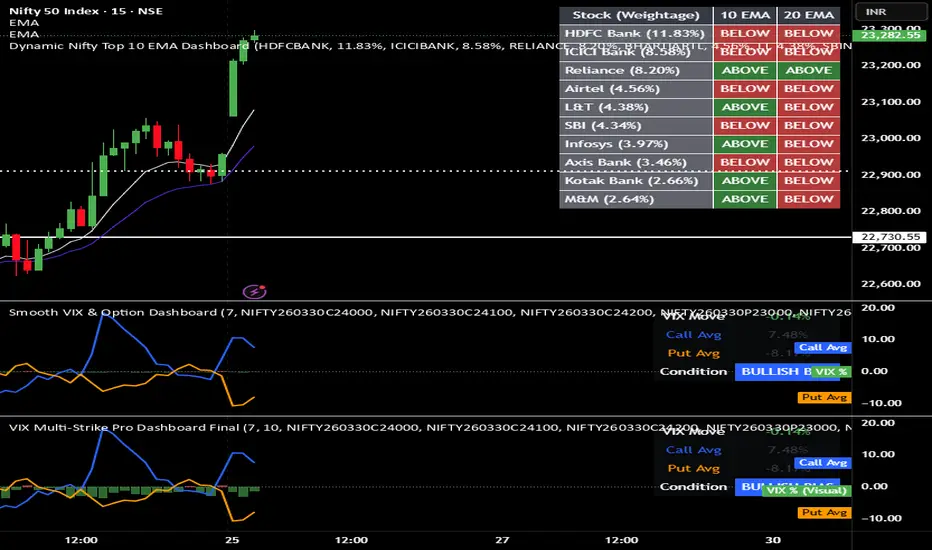
These Red and Green Bars are actually showing the status of the India VIX (Market Fear Index). Their movement up and down tells you whether "Fear" is increasing or decreasing in the market.
In simple terms, here is what they mean:
1. Red Bars (VIX is Up 📈)
* What is happening: This means the India VIX has moved higher compared to the previous candle.
* Psychology: Uncertainty or fear is rising in the market.
* Impact: When these bars are large and Red, the premiums of both Calls and Puts start to rise.
* For Sellers: This is dangerous because the options you sold are becoming more expensive (Inflating).
2. Green Bars (VIX is Down 📉)
* What is happening: This means the India VIX is falling.
* Psychology: The market is cooling down; traders are no longer feeling as much fear.
* Impact: This causes a "Vega Crush." Premiums shrink (decay) rapidly.
* For Sellers: This is "Jackpot" time. You make money from both theta decay and the drop in volatility.
Relationship Between Bars and Lines (Blue/Orange):
You simply need to look for these combinations:
* Large Red Bars + Blue/Orange Lines Up: This is a "Volatility Spike." Regardless of the direction, premiums are inflating. The chance of hitting a stop-loss is higher.
* Large Green Bars + Blue/Orange Lines Down: This is a "Vega Crush." This is the best setup for 0.3 delta selling. Even if the market stays sideways, premiums will crash toward zero quickly.
Summary Table:
| Bar Color | VIX Status | Market Mood | Option Seller (You) |
|---|---|---|---|
| RED (High) | Up | Panic/Fear | Risk: Premiums will spike. |
| GREEN (High) | Down | Relaxed | Profit: Premiums will drop fast. |
| Small Bars | Flat | Stable | Normal: You get standard Theta decay. |
In simple terms, here is what they mean:
1. Red Bars (VIX is Up 📈)
* What is happening: This means the India VIX has moved higher compared to the previous candle.
* Psychology: Uncertainty or fear is rising in the market.
* Impact: When these bars are large and Red, the premiums of both Calls and Puts start to rise.
* For Sellers: This is dangerous because the options you sold are becoming more expensive (Inflating).
2. Green Bars (VIX is Down 📉)
* What is happening: This means the India VIX is falling.
* Psychology: The market is cooling down; traders are no longer feeling as much fear.
* Impact: This causes a "Vega Crush." Premiums shrink (decay) rapidly.
* For Sellers: This is "Jackpot" time. You make money from both theta decay and the drop in volatility.
Relationship Between Bars and Lines (Blue/Orange):
You simply need to look for these combinations:
* Large Red Bars + Blue/Orange Lines Up: This is a "Volatility Spike." Regardless of the direction, premiums are inflating. The chance of hitting a stop-loss is higher.
* Large Green Bars + Blue/Orange Lines Down: This is a "Vega Crush." This is the best setup for 0.3 delta selling. Even if the market stays sideways, premiums will crash toward zero quickly.
Summary Table:
| Bar Color | VIX Status | Market Mood | Option Seller (You) |
|---|---|---|---|
| RED (High) | Up | Panic/Fear | Risk: Premiums will spike. |
| GREEN (High) | Down | Relaxed | Profit: Premiums will drop fast. |
| Small Bars | Flat | Stable | Normal: You get standard Theta decay. |
オープンソーススクリプト
TradingViewの精神に則り、このスクリプトの作者はコードをオープンソースとして公開してくれました。トレーダーが内容を確認・検証できるようにという配慮です。作者に拍手を送りましょう!無料で利用できますが、コードの再公開はハウスルールに従う必要があります。

免責事項
これらの情報および投稿は、TradingViewが提供または承認する金融、投資、取引、またはその他の種類の助言もしくは推奨であることを意図したものではなく、またこれらに該当するものでもありません。詳細は利用規約をご覧ください。
オープンソーススクリプト
TradingViewの精神に則り、このスクリプトの作者はコードをオープンソースとして公開してくれました。トレーダーが内容を確認・検証できるようにという配慮です。作者に拍手を送りましょう!無料で利用できますが、コードの再公開はハウスルールに従う必要があります。
免責事項
これらの情報および投稿は、TradingViewが提供または承認する金融、投資、取引、またはその他の種類の助言もしくは推奨であることを意図したものではなく、またこれらに該当するものでもありません。詳細は利用規約をご覧ください。