アップデート済
Quantified Relative Volume
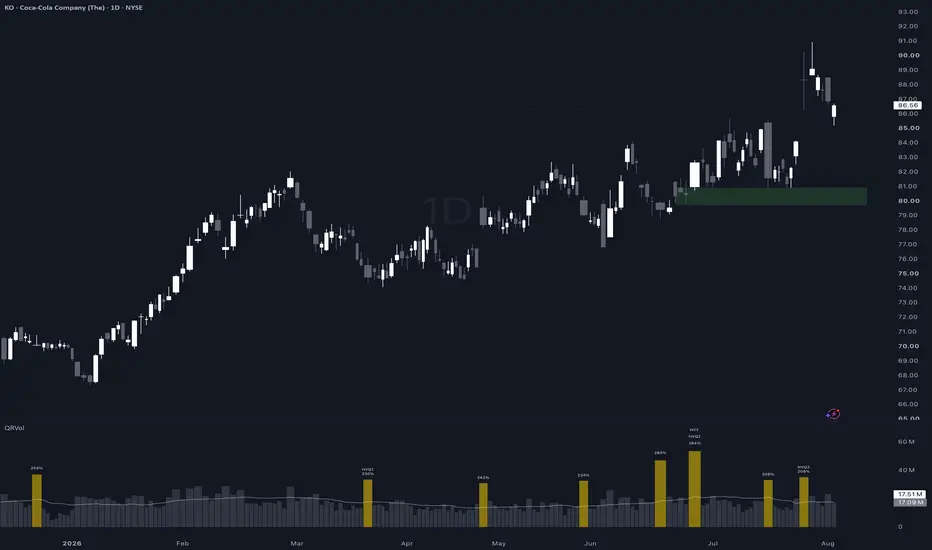
Quantified Relative Volume (QRVOL) highlights unusually high volume bars and quantifies exactly how strong they are - directly on the chart.
- Plots real volume with a configurable moving average filter (SMA, EMA, WMA, RMA, VWMA)
- Highlights bars where relative volume exceeds a user-defined threshold
- Displays the exact RVol % above each signal bar
- Automatically marks new volume records: HVE (Highest Volume Ever), HVY (Highest Volume of the Year), HVQ1–HVQ4 (Highest Volume per Quarter)
- All colors, thresholds, and label visibility are fully customizable
リリースノート
Updated toggles to show only long or short volume barsリリースノート
added 2 different color options for long + short rVol candles
免責事項
これらの情報および投稿は、TradingViewが提供または承認する金融、投資、取引、またはその他の種類の助言もしくは推奨であることを意図したものではなく、またこれらに該当するものでもありません。詳細は利用規約をご覧ください。
免責事項
これらの情報および投稿は、TradingViewが提供または承認する金融、投資、取引、またはその他の種類の助言もしくは推奨であることを意図したものではなく、またこれらに該当するものでもありません。詳細は利用規約をご覧ください。