OPEN-SOURCE SCRIPT
更新済 Gap Fill Probability for SPY SPX XSP
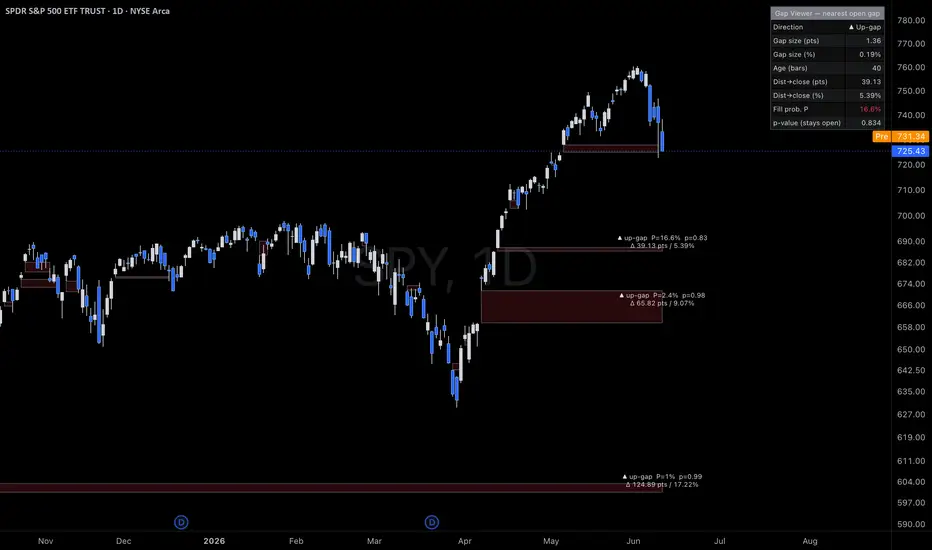
Gap Fill Probability Viewer - open gaps with an adaptive fill probability
Gap Fill Probability Viewer automatically finds price gaps on your chart and draws each one as a colored zone - no more drawing rectangles by hand. It then tells you how likely each open gap is to "fill," and exactly how far price has to travel to close it.
What it shows
How the probability works
The estimate adapts to three things research associates with gap fills:
- Size - bigger gaps are harder to fill.
- Distance - the closer price is to the gap, the higher the odds.
- Recency - fresh gaps fill faster; old, stubborn gaps lose momentum.
Handy options
- Auto-hide, fade, or keep gaps once they fill.
- Filter out tiny gaps by % or ATR.
- Detect gaps on wicks or candle bodies.
- Fully tunable probability model and colors.
⚠️ The fill probability is a heuristic estimate for study and education — not a guarantee or financial advice. Calibrate the settings to your own market and timeframe.
Gap Fill Probability Viewer automatically finds price gaps on your chart and draws each one as a colored zone - no more drawing rectangles by hand. It then tells you how likely each open gap is to "fill," and exactly how far price has to travel to close it.
What it shows
- Gap zones - every gap-up and gap-down, drawn as a box that extends to the current bar.
- Fill probability (P) - an estimate of how likely the gap is to close, shown as a % and color-coded (green = likely, orange = uncertain, red = unlikely).
- p-value - the flip side of P: the chance the gap stays open.
- Distance to close - how far the current price is from fully closing the gap, in both points and % of the charted symbol.
- Stats table - a clean summary for the gap closest to filling.
How the probability works
The estimate adapts to three things research associates with gap fills:
- Size - bigger gaps are harder to fill.
- Distance - the closer price is to the gap, the higher the odds.
- Recency - fresh gaps fill faster; old, stubborn gaps lose momentum.
Handy options
- Auto-hide, fade, or keep gaps once they fill.
- Filter out tiny gaps by % or ATR.
- Detect gaps on wicks or candle bodies.
- Fully tunable probability model and colors.
⚠️ The fill probability is a heuristic estimate for study and education — not a guarantee or financial advice. Calibrate the settings to your own market and timeframe.
リリースノート
Renamed, Chart updatedオープンソーススクリプト
TradingViewの精神に則り、このスクリプトの作者はコードをオープンソースとして公開してくれました。トレーダーが内容を確認・検証できるようにという配慮です。作者に拍手を送りましょう!無料で利用できますが、コードの再公開はハウスルールに従う必要があります。

免責事項
これらの情報および投稿は、TradingViewが提供または承認する金融、投資、取引、またはその他の種類の助言もしくは推奨であることを意図したものではなく、またこれらに該当するものでもありません。詳細は利用規約をご覧ください。
オープンソーススクリプト
TradingViewの精神に則り、このスクリプトの作者はコードをオープンソースとして公開してくれました。トレーダーが内容を確認・検証できるようにという配慮です。作者に拍手を送りましょう!無料で利用できますが、コードの再公開はハウスルールに従う必要があります。
免責事項
これらの情報および投稿は、TradingViewが提供または承認する金融、投資、取引、またはその他の種類の助言もしくは推奨であることを意図したものではなく、またこれらに該当するものでもありません。詳細は利用規約をご覧ください。