Percent Gainer - Multi-Timeframe FVG Layers
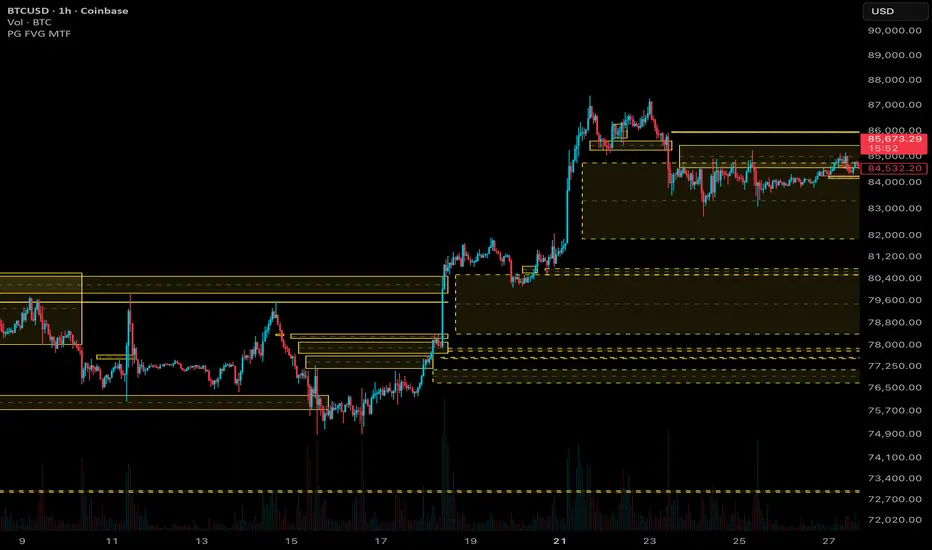
This indicator draws fair value gaps (FVGs) from up to three timeframes at once, each as its own color-coded layer. You can see a higher-timeframe gap and the current chart's gaps on the same chart, without repainting and without lookahead.
What counts as a fair value gap here
An FVG is a three-candle pattern. Candle 1 is the first candle, candle 2 is the middle candle, and candle 3 is the candle that completes the gap. This script uses a stricter rule than the basic gap definition.
Bullish gap (potential support)
Candle 3's low is above candle 1's high, which leaves the gap.
Candle 2 opens at or below candle 1's high.
Candle 3's low trades at or below candle 2's close.
The zone runs from candle 1's high (bottom) to candle 3's low (top).
Bearish gap (potential resistance)
Candle 3's high is below candle 1's low, which leaves the gap.
Candle 2 opens at or above candle 1's low.
Candle 3's high trades at or above candle 2's close.
The zone runs from candle 3's high (bottom) to candle 1's low (top).
Each layer has one color. Colors identify the timeframe, not the direction. A gap below current price is usually a bullish gap, and one above it is usually bearish. The color tells you which timeframe it came from.
How the timeframe layers work
Each layer has its own Timeframe setting. Leave it blank to use the chart timeframe. Default timeframes are Layer 1 = 60 minutes, Layer 2 = 15 minutes and Layer 3 = chart timeframe.
A layer only draws when its timeframe is the same as or higher than the chart's timeframe:
Higher than the chart (shown). A 4H layer (240) on a 1H chart draws every 4H gap on your 1H chart. This is the main use: higher-timeframe gaps as context while you trade a lower timeframe.
Same as the chart (shown). A 1H layer on a 1H chart draws that chart's own gaps, the same as leaving the field blank.
Lower than the chart (hidden). A 5-minute layer on a 1H chart is skipped. A 1H candle contains twelve 5-minute candles, and a 1H chart can't read each one, so most 5-minute gaps would be missed and the rest would be incomplete. Rather than show partial data, the layer draws nothing.
Hidden layers come back automatically when you switch to a chart at or below their timeframe. For example, with layers at 240, 15 and blank:
1H chart: the 4H gaps and the 1H gaps (blank layer) are shown. The 15-minute layer is hidden.
5-minute chart: all three are shown: 4H gaps, 15-minute gaps and 5-minute gaps.
Daily chart: only the blank layer (daily gaps) is shown. Both the 4H and 15-minute layers are hidden.
Layers are drawn in order, so Layer 1 appears on top of Layer 2, which appears on top of Layer 3.
When a zone appears
A gap only exists once its third candle has closed on that layer's timeframe. The box is drawn starting on the first chart bar after that close, then extends right while the gap stays open. A higher-timeframe gap therefore appears later than a chart-timeframe gap. A 4H gap shows up when its third 4H candle closes, not while that candle is still forming.
Mitigation (when a gap is considered filled)
Mitigation is checked once per completed candle of that layer's timeframe, using that candle's high, low and close. A 4H gap is judged by 4H candles, even when you're viewing a 1-minute chart. Price can trade into a 4H gap mid-candle, but the gap is only marked filled if the finished 4H candle meets the rule.
Mitigate on: Wick fills the gap when the candle's high or low reaches the threshold level. Close fills it only when the candle closes at or through the level.
Mitigation threshold: Tap (proximal edge) uses the edge price meets first. Midpoint (50%) uses the gap's middle. Full (distal edge) uses the far edge, so the gap must be completely filled.
Keep mitigated gaps: when on, a filled gap stays on the chart, frozen where it was filled, as a record of the level. When off, it's removed.
Mark mitigated gaps: when on, open gaps have a dashed border and filled gaps a solid one, so you can tell them apart at a glance.
Show FVG centerline / Centerline color: a dashed line at each gap's 50% level.
Per-layer settings
Show FVG 1 / 2 / 3: turns each layer on or off.
Timeframe: the timeframe that layer's gaps are detected on (see the rules above).
Color: that layer's box color.
Show last N gaps: how many gaps that layer keeps (up to 150). Once exceeded, the oldest gap is removed, whether it was filled or not.
Filter by time / Time window: when on, a gap is only drawn if its third candle opened inside this window, measured on that layer's timeframe.
Time window timezone (shared): the timezone for all three windows. The default is America/New_York (adjusts for daylight saving automatically). Use America/Chicago for Central time or Exchange for the symbol's own exchange time.
Non-repainting design
Every gap, time-window check and mitigation decision is read from a closed candle of that layer's timeframe, using request.security with lookahead turned off. Nothing is decided on the developing candle, so zones appear and get filled at the same point live as they do in history.
Limitations
Higher-timeframe gaps appear only after their candle closes, so they always lag the chart timeframe.
Gaps are only checked for mitigation at each layer candle's close. A 4H gap can look filled on a lower chart for several hours before it's marked filled.
Layers set lower than the chart timeframe are hidden by design (see above).
Box borders and centerlines share TradingView's drawing limits. Each layer is capped at 150 gaps, so up to 450 in total.
Use standard candles. On Heikin Ashi or other non-standard chart types, gaps are calculated from synthetic prices, not real ones.
This indicator is for educational and analytical purposes only. It is not financial advice, and past gap behavior does not guarantee future reactions.
What counts as a fair value gap here
An FVG is a three-candle pattern. Candle 1 is the first candle, candle 2 is the middle candle, and candle 3 is the candle that completes the gap. This script uses a stricter rule than the basic gap definition.
Bullish gap (potential support)
Candle 3's low is above candle 1's high, which leaves the gap.
Candle 2 opens at or below candle 1's high.
Candle 3's low trades at or below candle 2's close.
The zone runs from candle 1's high (bottom) to candle 3's low (top).
Bearish gap (potential resistance)
Candle 3's high is below candle 1's low, which leaves the gap.
Candle 2 opens at or above candle 1's low.
Candle 3's high trades at or above candle 2's close.
The zone runs from candle 3's high (bottom) to candle 1's low (top).
Each layer has one color. Colors identify the timeframe, not the direction. A gap below current price is usually a bullish gap, and one above it is usually bearish. The color tells you which timeframe it came from.
How the timeframe layers work
Each layer has its own Timeframe setting. Leave it blank to use the chart timeframe. Default timeframes are Layer 1 = 60 minutes, Layer 2 = 15 minutes and Layer 3 = chart timeframe.
A layer only draws when its timeframe is the same as or higher than the chart's timeframe:
Higher than the chart (shown). A 4H layer (240) on a 1H chart draws every 4H gap on your 1H chart. This is the main use: higher-timeframe gaps as context while you trade a lower timeframe.
Same as the chart (shown). A 1H layer on a 1H chart draws that chart's own gaps, the same as leaving the field blank.
Lower than the chart (hidden). A 5-minute layer on a 1H chart is skipped. A 1H candle contains twelve 5-minute candles, and a 1H chart can't read each one, so most 5-minute gaps would be missed and the rest would be incomplete. Rather than show partial data, the layer draws nothing.
Hidden layers come back automatically when you switch to a chart at or below their timeframe. For example, with layers at 240, 15 and blank:
1H chart: the 4H gaps and the 1H gaps (blank layer) are shown. The 15-minute layer is hidden.
5-minute chart: all three are shown: 4H gaps, 15-minute gaps and 5-minute gaps.
Daily chart: only the blank layer (daily gaps) is shown. Both the 4H and 15-minute layers are hidden.
Layers are drawn in order, so Layer 1 appears on top of Layer 2, which appears on top of Layer 3.
When a zone appears
A gap only exists once its third candle has closed on that layer's timeframe. The box is drawn starting on the first chart bar after that close, then extends right while the gap stays open. A higher-timeframe gap therefore appears later than a chart-timeframe gap. A 4H gap shows up when its third 4H candle closes, not while that candle is still forming.
Mitigation (when a gap is considered filled)
Mitigation is checked once per completed candle of that layer's timeframe, using that candle's high, low and close. A 4H gap is judged by 4H candles, even when you're viewing a 1-minute chart. Price can trade into a 4H gap mid-candle, but the gap is only marked filled if the finished 4H candle meets the rule.
Mitigate on: Wick fills the gap when the candle's high or low reaches the threshold level. Close fills it only when the candle closes at or through the level.
Mitigation threshold: Tap (proximal edge) uses the edge price meets first. Midpoint (50%) uses the gap's middle. Full (distal edge) uses the far edge, so the gap must be completely filled.
Keep mitigated gaps: when on, a filled gap stays on the chart, frozen where it was filled, as a record of the level. When off, it's removed.
Mark mitigated gaps: when on, open gaps have a dashed border and filled gaps a solid one, so you can tell them apart at a glance.
Show FVG centerline / Centerline color: a dashed line at each gap's 50% level.
Per-layer settings
Show FVG 1 / 2 / 3: turns each layer on or off.
Timeframe: the timeframe that layer's gaps are detected on (see the rules above).
Color: that layer's box color.
Show last N gaps: how many gaps that layer keeps (up to 150). Once exceeded, the oldest gap is removed, whether it was filled or not.
Filter by time / Time window: when on, a gap is only drawn if its third candle opened inside this window, measured on that layer's timeframe.
Time window timezone (shared): the timezone for all three windows. The default is America/New_York (adjusts for daylight saving automatically). Use America/Chicago for Central time or Exchange for the symbol's own exchange time.
Non-repainting design
Every gap, time-window check and mitigation decision is read from a closed candle of that layer's timeframe, using request.security with lookahead turned off. Nothing is decided on the developing candle, so zones appear and get filled at the same point live as they do in history.
Limitations
Higher-timeframe gaps appear only after their candle closes, so they always lag the chart timeframe.
Gaps are only checked for mitigation at each layer candle's close. A 4H gap can look filled on a lower chart for several hours before it's marked filled.
Layers set lower than the chart timeframe are hidden by design (see above).
Box borders and centerlines share TradingView's drawing limits. Each layer is capped at 150 gaps, so up to 450 in total.
Use standard candles. On Heikin Ashi or other non-standard chart types, gaps are calculated from synthetic prices, not real ones.
This indicator is for educational and analytical purposes only. It is not financial advice, and past gap behavior does not guarantee future reactions.

免責事項
これらの情報および投稿は、TradingViewが提供または承認する金融、投資、取引、またはその他の種類の助言もしくは推奨であることを意図したものではなく、またこれらに該当するものでもありません。詳細は利用規約をご覧ください。
免責事項
これらの情報および投稿は、TradingViewが提供または承認する金融、投資、取引、またはその他の種類の助言もしくは推奨であることを意図したものではなく、またこれらに該当するものでもありません。詳細は利用規約をご覧ください。