OPEN-SOURCE SCRIPT
更新済 P12 Session Levels
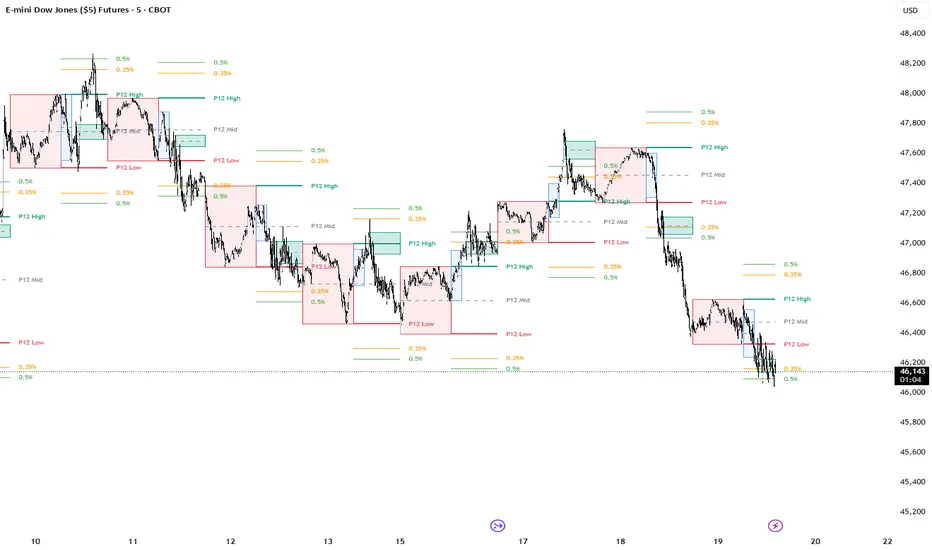
P12 – Previous 12 Hour Range
The P12 (Previous 12 Hour Range) indicator visualizes the high and low of the prior 12-hour period to provide a clear reference for current session context. The previous range can often act as a structural boundary where price may react, consolidate, or expand beyond as new liquidity enters the market.
By highlighting the prior 12-hour range directly on the chart, traders can quickly identify areas where price is interacting with recent market structure. Breaks, rejections, or rotations around this range can provide useful context for intraday analysis.
This concept is similar to approaches that study how price behaves relative to prior session ranges. Tools such as The Daily Profiler analyze historical session behavior to identify when highs and lows tend to occur. The P12 range provides a simple structural reference that traders can use alongside statistical timing studies, volume profile levels, or other forms of market structure analysis.
Features
Displays the high and low of the previous 12-hour range
Updates automatically as new sessions form
Helps visualize recent structural boundaries in the market
Can be combined with other analytical tools for context
This indicator is intended as a visual reference tool for studying market structure and range behavior and should be used alongside a trader’s existing analysis methods.
I personally use these extension levels with YM, you can find your own that work with you.
The P12 (Previous 12 Hour Range) indicator visualizes the high and low of the prior 12-hour period to provide a clear reference for current session context. The previous range can often act as a structural boundary where price may react, consolidate, or expand beyond as new liquidity enters the market.
By highlighting the prior 12-hour range directly on the chart, traders can quickly identify areas where price is interacting with recent market structure. Breaks, rejections, or rotations around this range can provide useful context for intraday analysis.
This concept is similar to approaches that study how price behaves relative to prior session ranges. Tools such as The Daily Profiler analyze historical session behavior to identify when highs and lows tend to occur. The P12 range provides a simple structural reference that traders can use alongside statistical timing studies, volume profile levels, or other forms of market structure analysis.
Features
Displays the high and low of the previous 12-hour range
Updates automatically as new sessions form
Helps visualize recent structural boundaries in the market
Can be combined with other analytical tools for context
This indicator is intended as a visual reference tool for studying market structure and range behavior and should be used alongside a trader’s existing analysis methods.
I personally use these extension levels with YM, you can find your own that work with you.
リリースノート
Updated extensions to change to user settings.Added 0600-0830 range and 930 opening range.
リリースノート
***オープンソーススクリプト
TradingViewの精神に則り、このスクリプトの作者はコードをオープンソースとして公開してくれました。トレーダーが内容を確認・検証できるようにという配慮です。作者に拍手を送りましょう!無料で利用できますが、コードの再公開はハウスルールに従う必要があります。

免責事項
これらの情報および投稿は、TradingViewが提供または承認する金融、投資、取引、またはその他の種類の助言もしくは推奨であることを意図したものではなく、またこれらに該当するものでもありません。詳細は利用規約をご覧ください。
オープンソーススクリプト
TradingViewの精神に則り、このスクリプトの作者はコードをオープンソースとして公開してくれました。トレーダーが内容を確認・検証できるようにという配慮です。作者に拍手を送りましょう!無料で利用できますが、コードの再公開はハウスルールに従う必要があります。
免責事項
これらの情報および投稿は、TradingViewが提供または承認する金融、投資、取引、またはその他の種類の助言もしくは推奨であることを意図したものではなく、またこれらに該当するものでもありません。詳細は利用規約をご覧ください。