アップデート済
XAUUSD Family Oscillator (XFO)
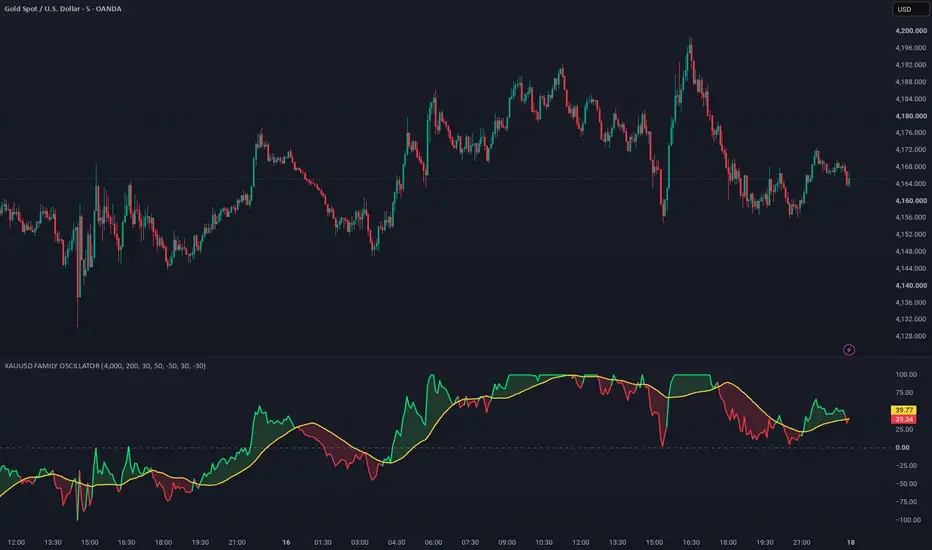
📘 XAUUSD Family Oscillator (XFO)
The XAUUSD Family Oscillator (XFO) is a technical indicator designed to visualize volatility-based momentum in the market.
It combines a volatility-adjusted channel with an oscillator and a smoothed signal line (SMA) to help traders identify potential overbought and oversold conditions, trend shifts, and strength changes in price movements.
The indicator is built around a mid-price SMA and dynamically adjusts its range based on recent candle volatility.
The oscillator reflects the position of the current price within this adaptive band, while the signal line provides a smoother trend confirmation.
Main Features:
Dynamic volatility-based oscillator.
Signal line (SMA) for trend confirmation.
Visual color change between bullish and bearish momentum.
Clean design — only oscillator and signal line shown.
Optional overbought/oversold reference levels for contextual analysis.
Disclaimer:
This indicator is for educational and analytical purposes only.
It is not financial advice and should not be used as a sole basis for investment decisions.
Always conduct your own analysis and manage risk responsibly.
The XAUUSD Family Oscillator (XFO) is a technical indicator designed to visualize volatility-based momentum in the market.
It combines a volatility-adjusted channel with an oscillator and a smoothed signal line (SMA) to help traders identify potential overbought and oversold conditions, trend shifts, and strength changes in price movements.
The indicator is built around a mid-price SMA and dynamically adjusts its range based on recent candle volatility.
The oscillator reflects the position of the current price within this adaptive band, while the signal line provides a smoother trend confirmation.
Main Features:
Dynamic volatility-based oscillator.
Signal line (SMA) for trend confirmation.
Visual color change between bullish and bearish momentum.
Clean design — only oscillator and signal line shown.
Optional overbought/oversold reference levels for contextual analysis.
Disclaimer:
This indicator is for educational and analytical purposes only.
It is not financial advice and should not be used as a sole basis for investment decisions.
Always conduct your own analysis and manage risk responsibly.
リリースノート
Updated chart snapshot so the oscillator is clearly visible (5m chart).
免責事項
これらの情報および投稿は、TradingViewが提供または承認する金融、投資、取引、またはその他の種類の助言もしくは推奨であることを意図したものではなく、またこれらに該当するものでもありません。詳細は利用規約をご覧ください。
免責事項
これらの情報および投稿は、TradingViewが提供または承認する金融、投資、取引、またはその他の種類の助言もしくは推奨であることを意図したものではなく、またこれらに該当するものでもありません。詳細は利用規約をご覧ください。