OPEN-SOURCE SCRIPT
FLEE MTF Context & Range
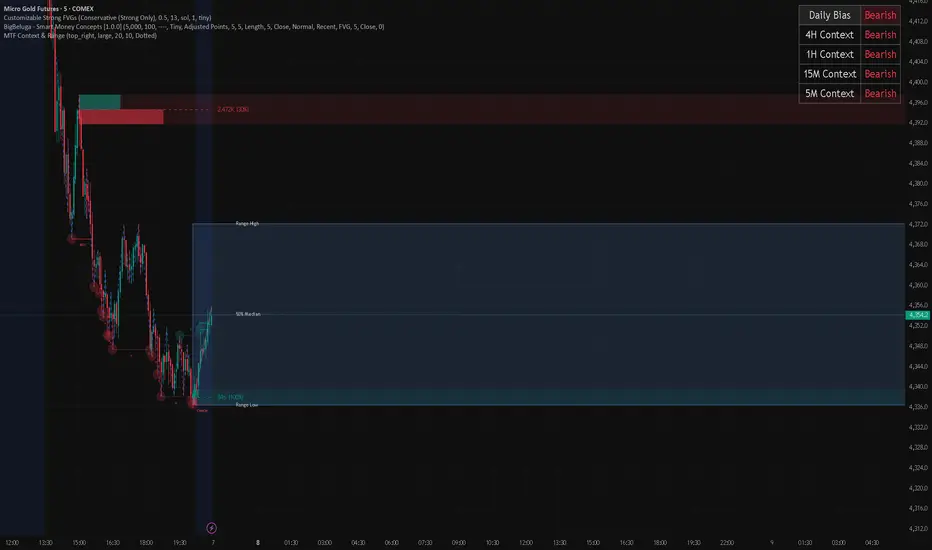
This indicator is a multi-timeframe market context tool. Its job is to help you quickly understand what the market is doing across multiple timeframes and what range price is currently trading inside.
It shows a context table in the top-right corner of the chart. That table tells you the trend direction for the 4H, 1H, 15M, and 5M timeframes. Each timeframe will show whether price is bullish, bearish, or neutral.
At the top of the table, it also shows the Daily overall bias. The daily bias is the main direction of the market, so you can quickly see whether the bigger picture is leaning bullish or bearish before taking trades on the lower timeframes.
The indicator also identifies the current range price is moving inside. When price is consolidating or trading between a high and a low, the indicator draws a transparent box around that range. The top of the box marks the range high, and the bottom marks the range low.
Inside the range box, the indicator draws a dotted 50% median line. This helps you see whether price is trading in the upper half or lower half of the range. The median can help with bias, entries, and understanding whether price is closer to premium or discount.
The indicator updates as the market moves. When a new range forms, the old range can disappear or stay depending on the settings. You can customize the colors, transparency, labels, timeframe options, and how sensitive the range detection is.
In simple words: this indicator tells you the trend on the higher and lower timeframes, gives you the daily bias, and visually marks the current price range with a 50% line so you can make cleaner trading decisions.
It shows a context table in the top-right corner of the chart. That table tells you the trend direction for the 4H, 1H, 15M, and 5M timeframes. Each timeframe will show whether price is bullish, bearish, or neutral.
At the top of the table, it also shows the Daily overall bias. The daily bias is the main direction of the market, so you can quickly see whether the bigger picture is leaning bullish or bearish before taking trades on the lower timeframes.
The indicator also identifies the current range price is moving inside. When price is consolidating or trading between a high and a low, the indicator draws a transparent box around that range. The top of the box marks the range high, and the bottom marks the range low.
Inside the range box, the indicator draws a dotted 50% median line. This helps you see whether price is trading in the upper half or lower half of the range. The median can help with bias, entries, and understanding whether price is closer to premium or discount.
The indicator updates as the market moves. When a new range forms, the old range can disappear or stay depending on the settings. You can customize the colors, transparency, labels, timeframe options, and how sensitive the range detection is.
In simple words: this indicator tells you the trend on the higher and lower timeframes, gives you the daily bias, and visually marks the current price range with a 50% line so you can make cleaner trading decisions.
オープンソーススクリプト
TradingViewの精神に則り、このスクリプトの作者はコードをオープンソースとして公開してくれました。トレーダーが内容を確認・検証できるようにという配慮です。作者に拍手を送りましょう!無料で利用できますが、コードの再公開はハウスルールに従う必要があります。

免責事項
これらの情報および投稿は、TradingViewが提供または承認する金融、投資、取引、またはその他の種類の助言もしくは推奨であることを意図したものではなく、またこれらに該当するものでもありません。詳細は利用規約をご覧ください。
オープンソーススクリプト
TradingViewの精神に則り、このスクリプトの作者はコードをオープンソースとして公開してくれました。トレーダーが内容を確認・検証できるようにという配慮です。作者に拍手を送りましょう!無料で利用できますが、コードの再公開はハウスルールに従う必要があります。
免責事項
これらの情報および投稿は、TradingViewが提供または承認する金融、投資、取引、またはその他の種類の助言もしくは推奨であることを意図したものではなく、またこれらに該当するものでもありません。詳細は利用規約をご覧ください。