Wyatt's Key Moving Averages (MTF)
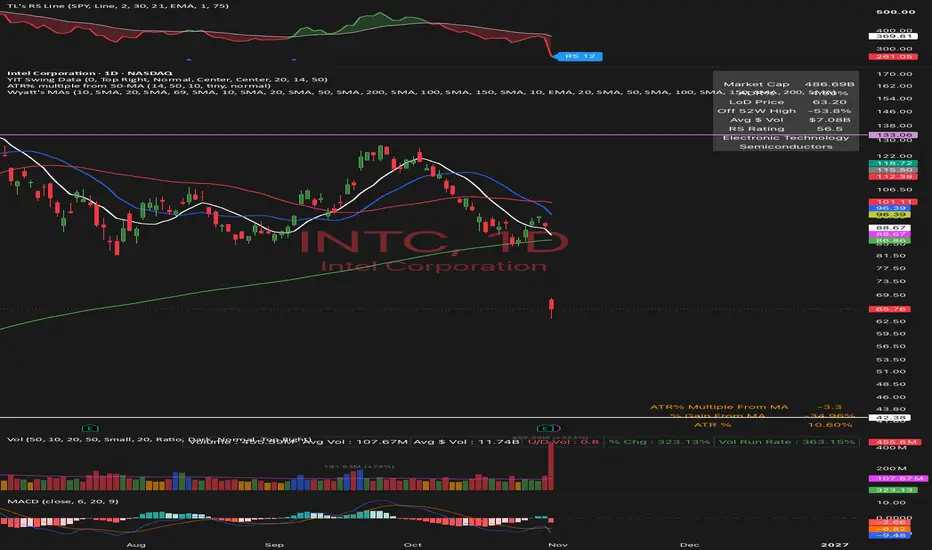
Key Moving Averages (MTF) is an indicator that plots moving averages from several timeframes on one chart. Intraday MAs use the bars you’re viewing, while daily and weekly MAs are calculated on their own timeframes and projected onto any chart, so a 10-day SMA on a 30-minute chart reflects 10 days of closing prices instead of the last 10 half-hour bars. Each slot has its own on/off switch, period, MA type (SMA, EMA, WMA, or VWMA), color, and an optional “Lower TF” setting that controls whether a higher-timeframe average also appears on intraday charts. The goal is to keep key daily and weekly levels visible while you trade shorter timeframes.

免責事項
これらの情報および投稿は、TradingViewが提供または承認する金融、投資、取引、またはその他の種類の助言もしくは推奨であることを意図したものではなく、またこれらに該当するものでもありません。詳細は利用規約をご覧ください。
免責事項
これらの情報および投稿は、TradingViewが提供または承認する金融、投資、取引、またはその他の種類の助言もしくは推奨であることを意図したものではなく、またこれらに該当するものでもありません。詳細は利用規約をご覧ください。