TBSMMR | TradeBee
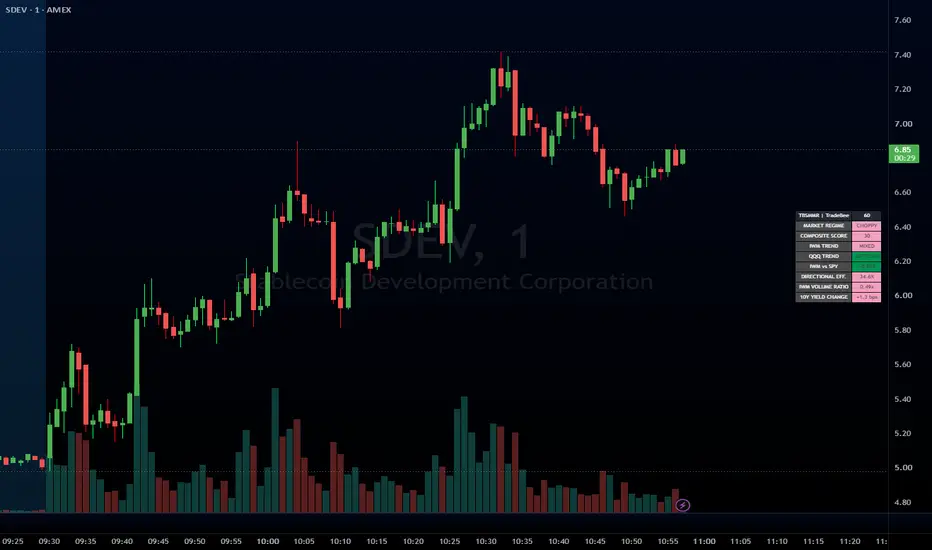
Purpose: Small-Cap Market Regime (TBSMMR) evaluates overall US small-cap market conditions and classifies the market as Bullish, Choppy, or Bearish.
Key Features :
Market indicators: IWM, QQQ, SPY, and US 10-Year Treasury yield.
Composite Score: Combines trend, relative strength, directional efficiency, volume, and yield movements.
Market Regime: Identifies BULLISH, CHOPPY, or BEARISH conditions.
Trend Labels: Displays UPTREND, DOWNTREND, or MIXED for IWM and QQQ.
Dashboard: Customizable position, font size, and displayed metrics, including centre positioning.
Visual Indicators: Color-coded regime and score, with optional IWM EMA 20 and EMA 50 plots.
Alerts: Notifications when the market regime changes.
Color Interpretation
Green Bullish
Pink Choppy / Mixed
Red Bearish
Important Notes :
The default analysis timeframe is daily. The default bullish threshold is +35, and the bearish threshold is −25, subject to the additional regime rules. The composite score is a rule-based market indicator, not a probability or a standalone buy/sell signal.
DASHBOARD ELEMENTS & INTERPRETATION
1. MARKET REGIME
Shows the overall market condition.
BULLISH - Positive market conditions.
CHOPPY - Mixed or less directional conditions.
BEARISH - Negative market conditions.
2. COMPOSITE SCORE
Combines trend, relative strength, directional efficiency,
volume and Treasury yield movements.
Higher score - More bullish inputs.
Lower score - More bearish inputs.
The background color reflects the overall market regime,
not just whether the score is positive or negative.
3. IWM TREND
Shows the trend of the Russell 2000 small-cap ETF.
UPTREND - Price above EMA 20, and EMA 20 above EMA 50.
DOWNTREND - Price below EMA 20, and EMA 20 below EMA 50.
MIXED - Neither condition is satisfied.
4. QQQ TREND
Shows the trend of the Nasdaq-100 ETF.
Uses the same EMA 20 and EMA 50 rules as IWM.
Helps assess whether Nasdaq stocks confirm the small-cap trend.
5. IWM vs SPY
Compares IWM's return with SPY's return over the selected
lookback period.
Positive value - IWM is outperforming SPY.
Negative value - IWM is underperforming SPY.
6. DIRECTIONAL EFFICIENCY
Measures how directly IWM price has moved over the lookback.
Higher value - More directional price movement.
Lower value - Choppier price movement.
Default regime filter: 35%.
7. IWM VOLUME RATIO
Compares current IWM volume with its average volume.
1.0x - Average volume.
Above 1.2x - Stronger-than-average volume using the default
setting.
Consider volume together with price direction.
8. 10Y YIELD CHANGE
Shows the change in the US 10-year Treasury yield over the
selected lookback, expressed in basis points (bps).
Rising yields - Can put pressure on equities.
Falling yields - Can ease pressure on equities.
Default pressure threshold: +10 bps or -10 bps.
COLOUR GUIDE
GREEN - Bullish
PINK - Choppy / Mixed
RED - Bearish
QUICK INTERPRETATION
* BULLISH regime + IWM and QQQ UPTREND:
Trend signals are aligned positively.
* CHOPPY regime + MIXED trends or low efficiency:
Signals are less aligned or price movement is less directional.
* BEARISH regime + IWM DOWNTREND:
Small-cap weakness is consistent with the bearish classification.
* Conflicting readings:
Review the individual dashboard elements to understand what
is influencing the overall regime.
IMPORTANT NOTE
A BEARISH regime can also be triggered by the additional IWM
bearish-trend rule, even when the composite score is above
the bearish score threshold.
TBSMMR is a rule-based market assessment, not a guarantee of
future performance or a standalone buy/sell signal.
Key Features :
Market indicators: IWM, QQQ, SPY, and US 10-Year Treasury yield.
Composite Score: Combines trend, relative strength, directional efficiency, volume, and yield movements.
Market Regime: Identifies BULLISH, CHOPPY, or BEARISH conditions.
Trend Labels: Displays UPTREND, DOWNTREND, or MIXED for IWM and QQQ.
Dashboard: Customizable position, font size, and displayed metrics, including centre positioning.
Visual Indicators: Color-coded regime and score, with optional IWM EMA 20 and EMA 50 plots.
Alerts: Notifications when the market regime changes.
Color Interpretation
Green Bullish
Pink Choppy / Mixed
Red Bearish
Important Notes :
The default analysis timeframe is daily. The default bullish threshold is +35, and the bearish threshold is −25, subject to the additional regime rules. The composite score is a rule-based market indicator, not a probability or a standalone buy/sell signal.
DASHBOARD ELEMENTS & INTERPRETATION
1. MARKET REGIME
Shows the overall market condition.
BULLISH - Positive market conditions.
CHOPPY - Mixed or less directional conditions.
BEARISH - Negative market conditions.
2. COMPOSITE SCORE
Combines trend, relative strength, directional efficiency,
volume and Treasury yield movements.
Higher score - More bullish inputs.
Lower score - More bearish inputs.
The background color reflects the overall market regime,
not just whether the score is positive or negative.
3. IWM TREND
Shows the trend of the Russell 2000 small-cap ETF.
UPTREND - Price above EMA 20, and EMA 20 above EMA 50.
DOWNTREND - Price below EMA 20, and EMA 20 below EMA 50.
MIXED - Neither condition is satisfied.
4. QQQ TREND
Shows the trend of the Nasdaq-100 ETF.
Uses the same EMA 20 and EMA 50 rules as IWM.
Helps assess whether Nasdaq stocks confirm the small-cap trend.
5. IWM vs SPY
Compares IWM's return with SPY's return over the selected
lookback period.
Positive value - IWM is outperforming SPY.
Negative value - IWM is underperforming SPY.
6. DIRECTIONAL EFFICIENCY
Measures how directly IWM price has moved over the lookback.
Higher value - More directional price movement.
Lower value - Choppier price movement.
Default regime filter: 35%.
7. IWM VOLUME RATIO
Compares current IWM volume with its average volume.
1.0x - Average volume.
Above 1.2x - Stronger-than-average volume using the default
setting.
Consider volume together with price direction.
8. 10Y YIELD CHANGE
Shows the change in the US 10-year Treasury yield over the
selected lookback, expressed in basis points (bps).
Rising yields - Can put pressure on equities.
Falling yields - Can ease pressure on equities.
Default pressure threshold: +10 bps or -10 bps.
COLOUR GUIDE
GREEN - Bullish
PINK - Choppy / Mixed
RED - Bearish
QUICK INTERPRETATION
* BULLISH regime + IWM and QQQ UPTREND:
Trend signals are aligned positively.
* CHOPPY regime + MIXED trends or low efficiency:
Signals are less aligned or price movement is less directional.
* BEARISH regime + IWM DOWNTREND:
Small-cap weakness is consistent with the bearish classification.
* Conflicting readings:
Review the individual dashboard elements to understand what
is influencing the overall regime.
IMPORTANT NOTE
A BEARISH regime can also be triggered by the additional IWM
bearish-trend rule, even when the composite score is above
the bearish score threshold.
TBSMMR is a rule-based market assessment, not a guarantee of
future performance or a standalone buy/sell signal.

免責事項
これらの情報および投稿は、TradingViewが提供または承認する金融、投資、取引、またはその他の種類の助言もしくは推奨であることを意図したものではなく、またこれらに該当するものでもありません。詳細は利用規約をご覧ください。
免責事項
これらの情報および投稿は、TradingViewが提供または承認する金融、投資、取引、またはその他の種類の助言もしくは推奨であることを意図したものではなく、またこれらに該当するものでもありません。詳細は利用規約をご覧ください。