OPEN-SOURCE SCRIPT
Masayan Volume Zone Profile Indicator
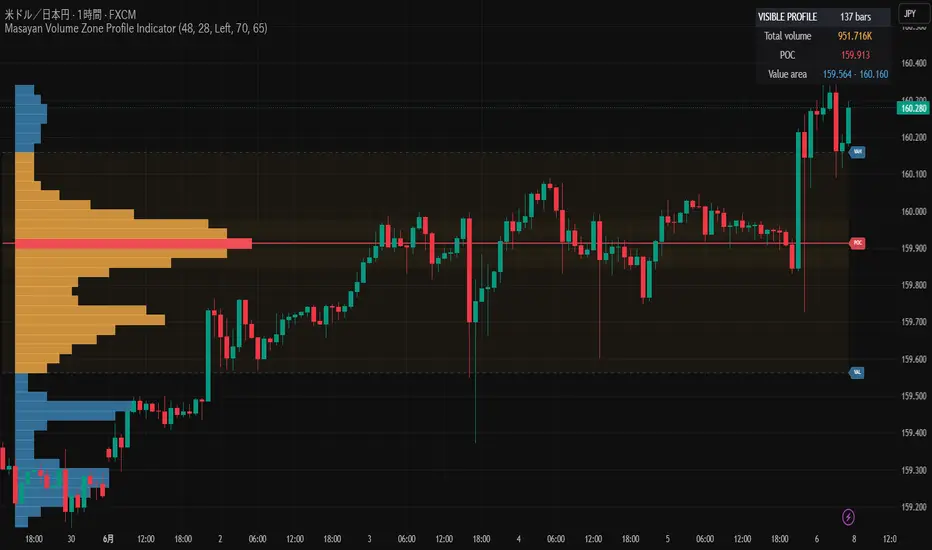
Masayan Volume Zone Profile Indicator is a dynamic volume-zone analysis tool that automatically calculates an estimated volume profile from all bars currently visible on the chart.
The indicator detects the chart’s visible range and recalculates whenever the user scrolls or zooms. No fixed lookback period is required.
Each visible candle’s TradingView volume is distributed across the price rows overlapped by its high-low range. The resulting profile highlights the price zones where the greatest estimated volume was concentrated.
Main features:
Automatic visible-chart range detection
Dynamic recalculation when scrolling or zooming
Estimated price-by-volume profile
Visible-range total volume summary
Estimated Point of Control
Value Area High and Value Area Low
Highlighted high-volume zones
Left or right profile positioning
POC-cross and value-area-entry alerts
Optional display controls
The profile is always drawn inside the currently visible chart range. Value-area volume bars are displayed in orange, volume outside the value area is displayed in blue, and the Point of Control is highlighted in red.
This indicator does not use broker order-book data, actual bid/ask volume, or market participant positions. The displayed profile is estimated from TradingView volume data and candle price ranges.
For forex symbols, TradingView volume may represent tick volume rather than centralized traded volume.
This script is intended for chart analysis, research, and educational purposes only.
It does not guarantee future performance and should not be considered financial advice.
Please test carefully before using it in any trading decision.
The indicator detects the chart’s visible range and recalculates whenever the user scrolls or zooms. No fixed lookback period is required.
Each visible candle’s TradingView volume is distributed across the price rows overlapped by its high-low range. The resulting profile highlights the price zones where the greatest estimated volume was concentrated.
Main features:
Automatic visible-chart range detection
Dynamic recalculation when scrolling or zooming
Estimated price-by-volume profile
Visible-range total volume summary
Estimated Point of Control
Value Area High and Value Area Low
Highlighted high-volume zones
Left or right profile positioning
POC-cross and value-area-entry alerts
Optional display controls
The profile is always drawn inside the currently visible chart range. Value-area volume bars are displayed in orange, volume outside the value area is displayed in blue, and the Point of Control is highlighted in red.
This indicator does not use broker order-book data, actual bid/ask volume, or market participant positions. The displayed profile is estimated from TradingView volume data and candle price ranges.
For forex symbols, TradingView volume may represent tick volume rather than centralized traded volume.
This script is intended for chart analysis, research, and educational purposes only.
It does not guarantee future performance and should not be considered financial advice.
Please test carefully before using it in any trading decision.
オープンソーススクリプト
TradingViewの精神に則り、このスクリプトの作者はコードをオープンソースとして公開してくれました。トレーダーが内容を確認・検証できるようにという配慮です。作者に拍手を送りましょう!無料で利用できますが、コードの再公開はハウスルールに従う必要があります。

免責事項
これらの情報および投稿は、TradingViewが提供または承認する金融、投資、取引、またはその他の種類の助言もしくは推奨であることを意図したものではなく、またこれらに該当するものでもありません。詳細は利用規約をご覧ください。
オープンソーススクリプト
TradingViewの精神に則り、このスクリプトの作者はコードをオープンソースとして公開してくれました。トレーダーが内容を確認・検証できるようにという配慮です。作者に拍手を送りましょう!無料で利用できますが、コードの再公開はハウスルールに従う必要があります。
免責事項
これらの情報および投稿は、TradingViewが提供または承認する金融、投資、取引、またはその他の種類の助言もしくは推奨であることを意図したものではなく、またこれらに該当するものでもありません。詳細は利用規約をご覧ください。