OPEN-SOURCE SCRIPT
COT Category Screener [invincible3]
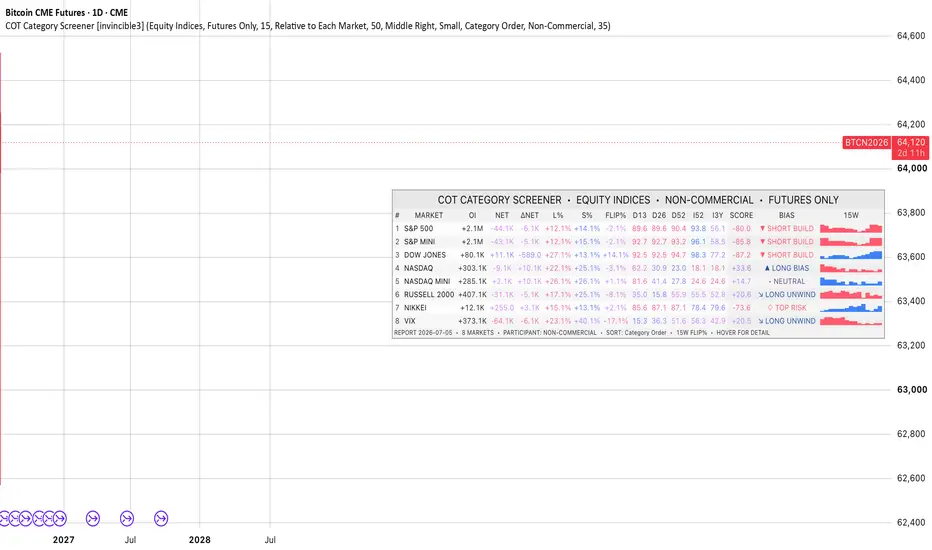
COT Category Screener — Participant Select
The COT Category Screener is a professional Commitment of Traders dashboard designed to compare positioning across multiple futures markets from one compact table.
It uses Legacy COT data and allows traders to analyze either Non-Commercial or Commercial participants. Every displayed metric—including net positioning, historical indices, score, bias, ranking, and weekly history—automatically adapts to the selected participant.
MARKET CATEGORIES
The screener supports the following groups:
• Metals
• Energy
• Grains & Oilseeds
• Soft Commodities
• Livestock
• Equity Indices
• Cryptocurrencies
• Major Currencies
• Emerging-Market Currencies
Depending on the selected category, the dashboard compares up to eight markets simultaneously.
PARTICIPANT SELECTION
Choose between:
Non-Commercial
Primarily reflects speculative positioning from large traders such as funds and institutional market participants.
Commercial
Reflects the positioning stance of commercial participants and hedgers.
Commercial mode represents the Commercial participant-side perspective. It should not automatically be interpreted as a contrarian market signal.
When Commercial and Non-Commercial positioning spreads are symmetrical, their displayed scores and bias states will naturally appear opposite.
DASHBOARD METRICS
OI — Open Interest
Displays the total number of outstanding contracts reported for the selected market.
NET — Net Position
Calculated as:
Long Positions − Short Positions
A positive value indicates net-long positioning, while a negative value indicates net-short positioning.
ΔNET — Weekly Net Change
Measures the change in the selected participant’s net position compared with the previous COT report.
It helps identify whether participants are:
• Adding long exposure
• Reducing long exposure
• Adding short exposure
• Covering short exposure
L% and S%
Displays the selected participant’s long and short positions as a percentage of total open interest.
FLIP%
Calculated as:
Long% − Short%
A positive Flip% indicates stronger long exposure, while a negative Flip% indicates stronger short exposure.
HISTORICAL DIFFERENCE MODEL
The screener calculates the historical position of the spread between the selected participant and the opposite participant over three report windows:
• D13 — 13-report difference index
• D26 — 26-report difference index
• D52 — 52-report difference index
These values range from 0 to 100.
In the screener’s model:
• Lower Difference values contribute to a more bullish score.
• Higher Difference values contribute to a more bearish score.
The three windows are weighted as follows:
• D13: 20%
• D26: 30%
• D52: 50%
The longer-term D52 component therefore carries the greatest influence.
COT POSITION INDICES
I52
Shows the selected participant’s current net position relative to its historical range over the previous 52 reports.
I3Y
Shows the same relative position over 156 reports, approximately three years of weekly COT history.
Values near 0 indicate positioning near the lower end of the historical range.
Values near 100 indicate positioning near the upper end of the historical range.
These indices describe historical positioning extremes and should be interpreted together with the participant type, Difference readings, weekly net change, and overall bias.
COMPOSITE SCORE
The screener converts the weighted D13, D26, and D52 readings into a normalized score ranging from:
• +100 — Strong bullish positioning setup
• 0 — Neutral or mixed positioning
• −100 — Strong bearish positioning setup
The score is designed for relative comparison and ranking across markets within the selected category.
BIAS STATES
▲ BUY
Positioning has reached a potential bottom-zone setup.
This identifies an extreme condition, but it does not confirm that positioning has already reversed.
↗ BULL TURN
Short- and medium-term positioning has begun turning upward from a bullish extreme.
▲ LONG BUILD
A bullish turn is supported by a positive weekly change in net positioning, indicating that the selected participant is actively building long exposure.
▲ LONG BIAS
Positioning remains within the bullish side of the model, although a fresh turning condition is not present.
↘ LONG UNWIND
The broader positioning structure remains bullish, but net exposure declined during the latest report.
↗ SHORT COVER
The broader structure remains bearish, but net positioning increased, suggesting that short exposure may be reducing.
▼ SHORT BIAS
Positioning remains within the bearish side of the model without a newly confirmed bearish turn.
◇ TOP RISK
Positioning has reached a potential upper-zone or overcrowded extreme.
This is a risk condition rather than an immediate sell confirmation.
↘ BEAR TURN
Short- and medium-term positioning has begun turning downward from a bearish extreme.
▼ SHORT BUILD
A bearish turn is supported by a negative weekly change in net positioning, indicating active short-position accumulation or long-position reduction.
• NEUTRAL
Positioning is mixed and does not meet the defined bullish or bearish thresholds.
— NO DATA
Sufficient historical COT observations are not yet available for the selected calculation.
WEEKLY POSITIONING HISTORY
The final column displays a compact 10–15 week Flip% sparkline.
Each vertical character represents one COT reporting week:
• The oldest report appears on the left.
• The most recent report appears on the right.
• Taller bars represent stronger relative Flip% readings.
The history can be normalized independently for each market or displayed using a fixed percentage range.
Hover over the history cell to view the underlying weekly values.
SORTING OPTIONS
Markets can be arranged by:
• Category Order
• Bullish → Bearish
• Bearish → Bullish
• Strongest Extreme
This makes it easier to identify the strongest relative opportunities or risks within a market group.
VISUAL DESIGN
The dashboard uses neutral table surfaces with value-colored typography rather than full-cell heatmap coloring.
It automatically adapts to light and dark chart themes and includes detailed hover tooltips for:
• CFTC market codes
• Raw positioning values
• Difference readings
• Historical indices
• Composite scores
• Bias calculations
• Weekly Flip% history
DATA OPTIONS
The user can select between:
• Futures Only
• Futures and Options Combined
All calculations are based on weekly COT reports and are not intended to represent real-time positioning.
SUGGESTED USE
This screener is designed for:
• Identifying historically crowded positioning
• Comparing related futures markets
• Detecting positioning accumulation or distribution
• Monitoring speculative and commercial behavior separately
• Locating potential medium-term bottom or top setups
• Confirming broader macro or price-action analysis
COT positioning is generally more suitable for contextual and medium-term analysis than precise entry timing.
Signals should be combined with price structure, trend, momentum, volatility, and appropriate risk-management rules.
DISCLAIMER
This indicator is an analytical tool and does not constitute financial advice.
Historical positioning extremes do not guarantee a market reversal or continuation.
The COT Category Screener is a professional Commitment of Traders dashboard designed to compare positioning across multiple futures markets from one compact table.
It uses Legacy COT data and allows traders to analyze either Non-Commercial or Commercial participants. Every displayed metric—including net positioning, historical indices, score, bias, ranking, and weekly history—automatically adapts to the selected participant.
MARKET CATEGORIES
The screener supports the following groups:
• Metals
• Energy
• Grains & Oilseeds
• Soft Commodities
• Livestock
• Equity Indices
• Cryptocurrencies
• Major Currencies
• Emerging-Market Currencies
Depending on the selected category, the dashboard compares up to eight markets simultaneously.
PARTICIPANT SELECTION
Choose between:
Non-Commercial
Primarily reflects speculative positioning from large traders such as funds and institutional market participants.
Commercial
Reflects the positioning stance of commercial participants and hedgers.
Commercial mode represents the Commercial participant-side perspective. It should not automatically be interpreted as a contrarian market signal.
When Commercial and Non-Commercial positioning spreads are symmetrical, their displayed scores and bias states will naturally appear opposite.
DASHBOARD METRICS
OI — Open Interest
Displays the total number of outstanding contracts reported for the selected market.
NET — Net Position
Calculated as:
Long Positions − Short Positions
A positive value indicates net-long positioning, while a negative value indicates net-short positioning.
ΔNET — Weekly Net Change
Measures the change in the selected participant’s net position compared with the previous COT report.
It helps identify whether participants are:
• Adding long exposure
• Reducing long exposure
• Adding short exposure
• Covering short exposure
L% and S%
Displays the selected participant’s long and short positions as a percentage of total open interest.
FLIP%
Calculated as:
Long% − Short%
A positive Flip% indicates stronger long exposure, while a negative Flip% indicates stronger short exposure.
HISTORICAL DIFFERENCE MODEL
The screener calculates the historical position of the spread between the selected participant and the opposite participant over three report windows:
• D13 — 13-report difference index
• D26 — 26-report difference index
• D52 — 52-report difference index
These values range from 0 to 100.
In the screener’s model:
• Lower Difference values contribute to a more bullish score.
• Higher Difference values contribute to a more bearish score.
The three windows are weighted as follows:
• D13: 20%
• D26: 30%
• D52: 50%
The longer-term D52 component therefore carries the greatest influence.
COT POSITION INDICES
I52
Shows the selected participant’s current net position relative to its historical range over the previous 52 reports.
I3Y
Shows the same relative position over 156 reports, approximately three years of weekly COT history.
Values near 0 indicate positioning near the lower end of the historical range.
Values near 100 indicate positioning near the upper end of the historical range.
These indices describe historical positioning extremes and should be interpreted together with the participant type, Difference readings, weekly net change, and overall bias.
COMPOSITE SCORE
The screener converts the weighted D13, D26, and D52 readings into a normalized score ranging from:
• +100 — Strong bullish positioning setup
• 0 — Neutral or mixed positioning
• −100 — Strong bearish positioning setup
The score is designed for relative comparison and ranking across markets within the selected category.
BIAS STATES
▲ BUY
Positioning has reached a potential bottom-zone setup.
This identifies an extreme condition, but it does not confirm that positioning has already reversed.
↗ BULL TURN
Short- and medium-term positioning has begun turning upward from a bullish extreme.
▲ LONG BUILD
A bullish turn is supported by a positive weekly change in net positioning, indicating that the selected participant is actively building long exposure.
▲ LONG BIAS
Positioning remains within the bullish side of the model, although a fresh turning condition is not present.
↘ LONG UNWIND
The broader positioning structure remains bullish, but net exposure declined during the latest report.
↗ SHORT COVER
The broader structure remains bearish, but net positioning increased, suggesting that short exposure may be reducing.
▼ SHORT BIAS
Positioning remains within the bearish side of the model without a newly confirmed bearish turn.
◇ TOP RISK
Positioning has reached a potential upper-zone or overcrowded extreme.
This is a risk condition rather than an immediate sell confirmation.
↘ BEAR TURN
Short- and medium-term positioning has begun turning downward from a bearish extreme.
▼ SHORT BUILD
A bearish turn is supported by a negative weekly change in net positioning, indicating active short-position accumulation or long-position reduction.
• NEUTRAL
Positioning is mixed and does not meet the defined bullish or bearish thresholds.
— NO DATA
Sufficient historical COT observations are not yet available for the selected calculation.
WEEKLY POSITIONING HISTORY
The final column displays a compact 10–15 week Flip% sparkline.
Each vertical character represents one COT reporting week:
• The oldest report appears on the left.
• The most recent report appears on the right.
• Taller bars represent stronger relative Flip% readings.
The history can be normalized independently for each market or displayed using a fixed percentage range.
Hover over the history cell to view the underlying weekly values.
SORTING OPTIONS
Markets can be arranged by:
• Category Order
• Bullish → Bearish
• Bearish → Bullish
• Strongest Extreme
This makes it easier to identify the strongest relative opportunities or risks within a market group.
VISUAL DESIGN
The dashboard uses neutral table surfaces with value-colored typography rather than full-cell heatmap coloring.
It automatically adapts to light and dark chart themes and includes detailed hover tooltips for:
• CFTC market codes
• Raw positioning values
• Difference readings
• Historical indices
• Composite scores
• Bias calculations
• Weekly Flip% history
DATA OPTIONS
The user can select between:
• Futures Only
• Futures and Options Combined
All calculations are based on weekly COT reports and are not intended to represent real-time positioning.
SUGGESTED USE
This screener is designed for:
• Identifying historically crowded positioning
• Comparing related futures markets
• Detecting positioning accumulation or distribution
• Monitoring speculative and commercial behavior separately
• Locating potential medium-term bottom or top setups
• Confirming broader macro or price-action analysis
COT positioning is generally more suitable for contextual and medium-term analysis than precise entry timing.
Signals should be combined with price structure, trend, momentum, volatility, and appropriate risk-management rules.
DISCLAIMER
This indicator is an analytical tool and does not constitute financial advice.
Historical positioning extremes do not guarantee a market reversal or continuation.
オープンソーススクリプト
TradingViewの精神に則り、このスクリプトの作者はコードをオープンソースとして公開してくれました。トレーダーが内容を確認・検証できるようにという配慮です。作者に拍手を送りましょう!無料で利用できますが、コードの再公開はハウスルールに従う必要があります。

免責事項
これらの情報および投稿は、TradingViewが提供または承認する金融、投資、取引、またはその他の種類の助言もしくは推奨であることを意図したものではなく、またこれらに該当するものでもありません。詳細は利用規約をご覧ください。
オープンソーススクリプト
TradingViewの精神に則り、このスクリプトの作者はコードをオープンソースとして公開してくれました。トレーダーが内容を確認・検証できるようにという配慮です。作者に拍手を送りましょう!無料で利用できますが、コードの再公開はハウスルールに従う必要があります。
免責事項
これらの情報および投稿は、TradingViewが提供または承認する金融、投資、取引、またはその他の種類の助言もしくは推奨であることを意図したものではなく、またこれらに該当するものでもありません。詳細は利用規約をご覧ください。