OPEN-SOURCE SCRIPT
Normalized Coefficient of Variation
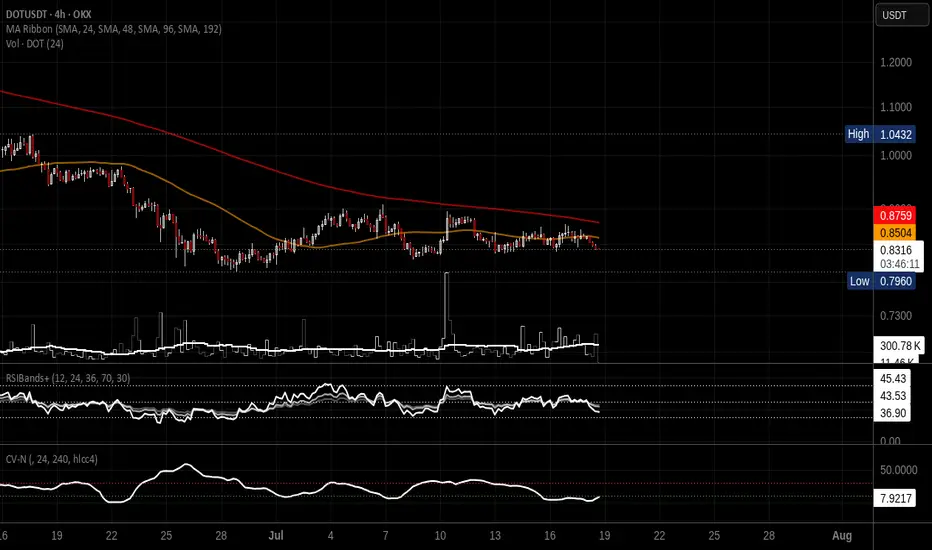
# Normalized Coefficient of Variation (CV)
This indicator measures market volatility using the **Coefficient of Variation (CV)**, defined as the ratio of the standard deviation to the simple moving average (SMA), expressed as a percentage.
Unlike the traditional CV, which has no upper limit and can vary significantly across different assets and market conditions, this indicator applies a **Rolling Min-Max Normalization** over a user-defined lookback period. The result is a dynamic oscillator scaled between **0 and 100**, making it easier to compare relative volatility across different symbols and timeframes.
## Formula
**Coefficient of Variation**
CV = (Standard Deviation / SMA) × 100
**Normalization**
Normalized CV = 100 × (CV − Lowest CV) / (Highest CV − Lowest CV)
where the lowest and highest CV values are calculated over the selected normalization lookback period.
## Features
* Rolling Min-Max normalization (0-100 scale)
* User-selectable calculation timeframe
* Adjustable CV period (default: 24)
* Adjustable normalization lookback (default: 250)
* Uses Simple Moving Average (SMA)
* White oscillator line for clear visualization
* Dotted reference levels at 10 and 30
* Hidden raw CV value available in the Data Window
## Interpretation
* Values below **10** indicate relatively low volatility compared to recent history.
* Values above **30** indicate relatively high volatility compared to recent history.
* Values approaching **100** represent the highest relative volatility observed within the selected normalization window.
* Values approaching **0** represent the lowest relative volatility observed within the selected normalization window.
Because the indicator is normalized, the displayed values represent **relative volatility within the selected lookback period**, not the absolute Coefficient of Variation percentage. This makes the indicator especially useful for comparing changing volatility regimes across different markets and timeframes.
This indicator is intended as a volatility analysis tool and should be used alongside price action and other technical indicators rather than as a standalone trading signal.
This indicator measures market volatility using the **Coefficient of Variation (CV)**, defined as the ratio of the standard deviation to the simple moving average (SMA), expressed as a percentage.
Unlike the traditional CV, which has no upper limit and can vary significantly across different assets and market conditions, this indicator applies a **Rolling Min-Max Normalization** over a user-defined lookback period. The result is a dynamic oscillator scaled between **0 and 100**, making it easier to compare relative volatility across different symbols and timeframes.
## Formula
**Coefficient of Variation**
CV = (Standard Deviation / SMA) × 100
**Normalization**
Normalized CV = 100 × (CV − Lowest CV) / (Highest CV − Lowest CV)
where the lowest and highest CV values are calculated over the selected normalization lookback period.
## Features
* Rolling Min-Max normalization (0-100 scale)
* User-selectable calculation timeframe
* Adjustable CV period (default: 24)
* Adjustable normalization lookback (default: 250)
* Uses Simple Moving Average (SMA)
* White oscillator line for clear visualization
* Dotted reference levels at 10 and 30
* Hidden raw CV value available in the Data Window
## Interpretation
* Values below **10** indicate relatively low volatility compared to recent history.
* Values above **30** indicate relatively high volatility compared to recent history.
* Values approaching **100** represent the highest relative volatility observed within the selected normalization window.
* Values approaching **0** represent the lowest relative volatility observed within the selected normalization window.
Because the indicator is normalized, the displayed values represent **relative volatility within the selected lookback period**, not the absolute Coefficient of Variation percentage. This makes the indicator especially useful for comparing changing volatility regimes across different markets and timeframes.
This indicator is intended as a volatility analysis tool and should be used alongside price action and other technical indicators rather than as a standalone trading signal.
オープンソーススクリプト
TradingViewの精神に則り、このスクリプトの作者はコードをオープンソースとして公開してくれました。トレーダーが内容を確認・検証できるようにという配慮です。作者に拍手を送りましょう!無料で利用できますが、コードの再公開はハウスルールに従う必要があります。

免責事項
これらの情報および投稿は、TradingViewが提供または承認する金融、投資、取引、またはその他の種類の助言もしくは推奨であることを意図したものではなく、またこれらに該当するものでもありません。詳細は利用規約をご覧ください。
オープンソーススクリプト
TradingViewの精神に則り、このスクリプトの作者はコードをオープンソースとして公開してくれました。トレーダーが内容を確認・検証できるようにという配慮です。作者に拍手を送りましょう!無料で利用できますが、コードの再公開はハウスルールに従う必要があります。
免責事項
これらの情報および投稿は、TradingViewが提供または承認する金融、投資、取引、またはその他の種類の助言もしくは推奨であることを意図したものではなく、またこれらに該当するものでもありません。詳細は利用規約をご覧ください。