BTC Network Relative Value
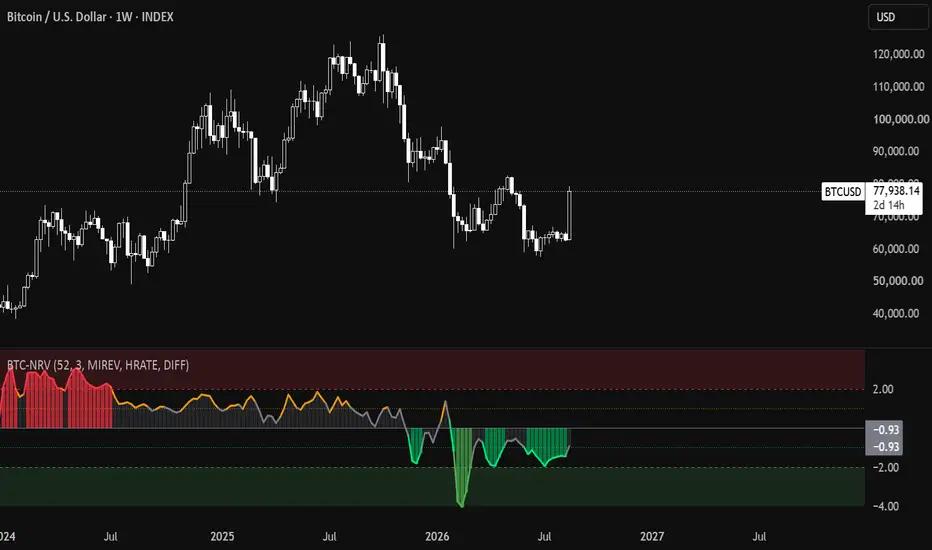
The BTC Network Relative Value (BTC-NRV) indicator is a macro-economic valuation framework designed to quantify Bitcoin’s market price against the intrinsic "work" being performed by the network. By shifting the focus from speculative price action to fundamental on-chain performance, this tool empowers investors to execute a data-driven Strategic Dollar Cost Averaging (SDCA) plan.
Why Relative Value Matters
Market price often deviates from network health due to sentiment, liquidity shocks, or macro cycles. This indicator acts as a "fair value" compass, utilizing a Z-Score methodology to normalize deviations. By measuring the price relative to the network's energy consumption (Hashrate), security (Difficulty), and mining profitability (Revenue), we can mathematically identify when Bitcoin is historically over- or under-priced.
Core On-Chain Data Pillars:
The indicator synthesizes three foundational network metrics into a singular valuation proxy:
Miner Revenue (MIREV): Reflects the total economic value extracted by the network (Block Rewards + Transaction Fees). It is a direct proxy for the "monetary demand" for network security.
Hashrate (HRATE): Serves as the ultimate indicator of the network's physical security and the long-term confidence of institutional-grade infrastructure providers.
Network Difficulty (DIFF): Acts as a protocol-level stabilizer, ensuring that our valuation metric is adjusted for the self-regulating nature of Bitcoin’s consensus mechanism.
Strategic Methodology:
Logarithmic Normalization: Bitcoin's exponential growth makes linear comparisons across different cycles (e.g., 2013 vs. 2025) inaccurate. The indicator applies logarithmic transformations to stabilize the variance, ensuring that a "top" in 2017 and a "top" in 2024 are comparable within the same oscillator bounds.
1-Year (52-Week) Z-Score: By utilizing a 1-year rolling lookback window on the Weekly (1W) timeframe, the indicator highlights how many standard deviations the current market price deviates from the mean network value.
Signal Smoothing: The 3-week moving average (smoothing) removes short-term on-chain noise, allowing investors to focus on the macro-trend rather than daily volatility.
SDCA Execution Framework (How to use):
The oscillator provides specific zones for long-term strategic planning:
Zone -2.0 SD and below (Green): Strategic Accumulation. Historically represents macro-level capitulation. This is the optimal window for aggressive capital deployment as the asset is deeply undervalued relative to network security.
Zone -1.0 to -2.0 SD (Light Green): Favorable Value. An undervalued state suitable for building core positions.
Zone -1.0 to +1.0 SD (Gray): Equilibrium. The market is trading at "Fair Value" relative to its network input. Maintain your standard, scheduled DCA.
Zone +1.0 to +2.0 SD (Orange): Cautionary Zone. The asset is becoming over-extended relative to network fundamentals.
Zone +2.0 SD and above (Red): Profit Realization / Pause. Historically marks speculative mania and macro cycle tops. Prudent investors often pause accumulation here or begin scaling out to realize gains.
Technical Recommendations:
Timeframe: Optimized for the Weekly (1W) chart for macro-cycle analysis.
Lookback: Set to 52 for 1-year macro alignment.
Smoothing: 3 to filter out mining-related data spikes.
Disclaimer: This indicator is for educational and strategic planning purposes only. It is not financial advice. On-chain data is sourced from external providers (Quandl) and may be subject to minor API latencies.
Why Relative Value Matters
Market price often deviates from network health due to sentiment, liquidity shocks, or macro cycles. This indicator acts as a "fair value" compass, utilizing a Z-Score methodology to normalize deviations. By measuring the price relative to the network's energy consumption (Hashrate), security (Difficulty), and mining profitability (Revenue), we can mathematically identify when Bitcoin is historically over- or under-priced.
Core On-Chain Data Pillars:
The indicator synthesizes three foundational network metrics into a singular valuation proxy:
Miner Revenue (MIREV): Reflects the total economic value extracted by the network (Block Rewards + Transaction Fees). It is a direct proxy for the "monetary demand" for network security.
Hashrate (HRATE): Serves as the ultimate indicator of the network's physical security and the long-term confidence of institutional-grade infrastructure providers.
Network Difficulty (DIFF): Acts as a protocol-level stabilizer, ensuring that our valuation metric is adjusted for the self-regulating nature of Bitcoin’s consensus mechanism.
Strategic Methodology:
Logarithmic Normalization: Bitcoin's exponential growth makes linear comparisons across different cycles (e.g., 2013 vs. 2025) inaccurate. The indicator applies logarithmic transformations to stabilize the variance, ensuring that a "top" in 2017 and a "top" in 2024 are comparable within the same oscillator bounds.
1-Year (52-Week) Z-Score: By utilizing a 1-year rolling lookback window on the Weekly (1W) timeframe, the indicator highlights how many standard deviations the current market price deviates from the mean network value.
Signal Smoothing: The 3-week moving average (smoothing) removes short-term on-chain noise, allowing investors to focus on the macro-trend rather than daily volatility.
SDCA Execution Framework (How to use):
The oscillator provides specific zones for long-term strategic planning:
Zone -2.0 SD and below (Green): Strategic Accumulation. Historically represents macro-level capitulation. This is the optimal window for aggressive capital deployment as the asset is deeply undervalued relative to network security.
Zone -1.0 to -2.0 SD (Light Green): Favorable Value. An undervalued state suitable for building core positions.
Zone -1.0 to +1.0 SD (Gray): Equilibrium. The market is trading at "Fair Value" relative to its network input. Maintain your standard, scheduled DCA.
Zone +1.0 to +2.0 SD (Orange): Cautionary Zone. The asset is becoming over-extended relative to network fundamentals.
Zone +2.0 SD and above (Red): Profit Realization / Pause. Historically marks speculative mania and macro cycle tops. Prudent investors often pause accumulation here or begin scaling out to realize gains.
Technical Recommendations:
Timeframe: Optimized for the Weekly (1W) chart for macro-cycle analysis.
Lookback: Set to 52 for 1-year macro alignment.
Smoothing: 3 to filter out mining-related data spikes.
Disclaimer: This indicator is for educational and strategic planning purposes only. It is not financial advice. On-chain data is sourced from external providers (Quandl) and may be subject to minor API latencies.

免責事項
これらの情報および投稿は、TradingViewが提供または承認する金融、投資、取引、またはその他の種類の助言もしくは推奨であることを意図したものではなく、またこれらに該当するものでもありません。詳細は利用規約をご覧ください。
免責事項
これらの情報および投稿は、TradingViewが提供または承認する金融、投資、取引、またはその他の種類の助言もしくは推奨であることを意図したものではなく、またこれらに該当するものでもありません。詳細は利用規約をご覧ください。